Flow Control


Overview
Flow Control enables intelligent request queuing at the llm-d Router level. Traditional load balancing falls short for LLMs because resource consumption varies wildly per request. Shifting queuing to the Router enables:
- Multi-Tenancy: Prevent noisy neighbors from starving others and enforce fairness between tenants. Compared to a single-workload deployment, operators of multi-tenant workloads have additional considerations:
- Certain tenants are higher-priority than others (e.g. paid vs unpaid).
- Certain requests have different SLOs than others (e.g. batch vs online).
- Certain tenants are more active than others, so fairness between them matters.
- No-Regret Scheduling: Hold requests during peak saturation instead of committing them to a server's local queue where they become stuck. By delaying dispatch until load subsides, the EPP ensures requests land on the best available resource.
How it Works
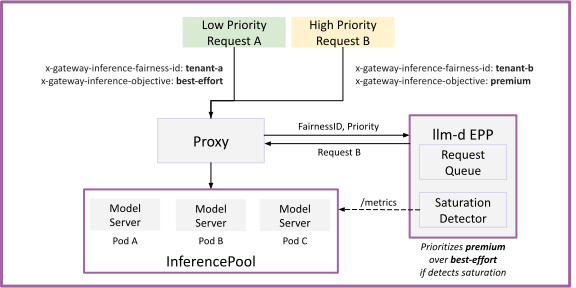
Requests arrive at the proxy with headers expressing their tenant ID and traffic priority. The EPP classifies each request by a FlowKey (Fairness ID + Priority), maintains separate in-memory queues for each flow, and assigns each flow to a PriorityBand (several tenants can share the same priority). In each scheduling cycle it dispatches based on:
- Priority: Servicing highest priority bands first.
- Fairness: Cycling through tenants within a band, as decided by the Fairness Policy.
- Ordering: Ordering requests within a flow, as decided by the Ordering Policy (e.g. FCFS or SLO-aware).
In the background, the EPP monitors the model servers for saturation; while it detects saturation, requests stay queued until it subsides.
While Backpressure protects the physical hardware from overload, the Multi-Tenancy policies dictate exactly how that delayed traffic is ordered and distributed among your users.
The following diagram illustrates the centralized queuing topology:
Default Configuration
The following default hardware configuration is inherited from the Optimized Baseline:
| Parameter | Value |
|---|---|
| Model | Qwen/Qwen3-32B |
| Replicas | 2 |
| Tensor Parallelism | 2 |
| GPUs per replica | 2 |
| Total GPUs | 4 |
When the flowControl feature gate is enabled, the EPP uses the following policies by default. These defaults are explicitly designed to mimic legacy, non-flow-control behavior (Strict FCFS) to ensure a seamless transition for existing workloads.
| Policy Type | Default Plugin | Description |
|---|---|---|
| Fairness | global-strict-fairness-policy | Ignores flow isolation and serves all requests in a single global order. |
| Ordering | fcfs-ordering-policy | First-Come, First-Served based on arrival time. |
| Saturation | utilization-detector | Closed-loop detector reacting to real-time telemetry. |
- Beneath the flow control layer, router/flow-control.values.yaml configures the EPP's standard prefix-cache and load-aware scorers (
prefix-cache-scorer,queue-scorer, andkv-cache-utilization-scorer). Flow control acts as an intelligent ingress layer that holds saturated traffic before it passes to the scheduler. - While
utilization-detectoris the out-of-the-box system default listed here, production deployments should switch toconcurrency-detectorto avoid telemetry lag risks, as detailed in the Tune Flow Control Concurrency.
By default, the EPP uses a global-strict policy. Because the system is work-conserving, it will never artificially throttle traffic if GPUs have spare capacity. However, enforcing strict fairness (like Round-Robin) during periods of saturation constrains the scheduler's ability to pick the globally optimal request for batching or cache reuse, thereby bounding the maximum explorable latency-throughput frontier. The default prioritizes absolute global throughput, while this guide overrides it to prioritize tenant equity.
Supported Hardware Backends
Flow Control is a software-level scheduling feature at the EPP layer and is entirely hardware-agnostic. It supports all accelerators detailed in the Optimized Baseline guide. Since this guide builds exactly on top of that baseline, we will dynamically deploy the baseline's model servers in the steps below rather than maintaining duplicate configurations.
The steps below default to NVIDIA GPU. See the "AMD ROCm" and "Intel XPU" details under Deploy the Model Server for other documented, dynamically-rendered paths. Other accelerators listed in the Optimized Baseline guide can be substituted the same way: swap the kustomize path in that step, then, if the target overlay's model or replica count differs from the Default Configuration table above, adjust the benchmarking/verification steps accordingly.
Prerequisites
- Have the proper client tools installed on your local system to use this guide.
- Checkout llm-d repo:
export BRANCH=main # branch, tag, or commit hash
git clone https://github.com/llm-d/llm-d.git && cd llm-d && git checkout ${BRANCH}
- Set the guide environment variables:
export REPO_ROOT=$(realpath $(git rev-parse --show-toplevel))
export GUIDE_NAME=flow-control
export NAMESPACE=llm-d-flow-control
export MODEL_NAME=Qwen/Qwen3-32B
export INFRA_PROVIDER=base # options: base, gke
export ROUTER_VALUES=${REPO_ROOT}/guides/${GUIDE_NAME}/router/${GUIDE_NAME}.values.yaml
export EXTRA_HELM_ARGS=
export MONITORING=false # options: false, true
- Source the common guide environment variables:
source ${REPO_ROOT}/guides/env.sh
- Install the required CRDs (GAIE InferencePool + llm-d.ai InferenceObjective):
# GAIE_URL is automatically calculated from GAIE_VERSION at ${REPO_ROOT}/guides/env.sh
kubectl apply -f https://github.com/kubernetes-sigs/gateway-api-inference-extension/${GAIE_URL}/v1-manifests.yaml

# ROUTER_RELEASE_URL is automatically calculated from ROUTER_RELEASE_VERSION at ${REPO_ROOT}/guides/env.sh
kubectl apply -f https://github.com/llm-d/llm-d-router/${ROUTER_RELEASE_URL}/manifests.yaml
- Create a target namespace for the installation:
kubectl create namespace ${NAMESPACE} --dry-run=client -o yaml | kubectl apply -f -
- Create the
llm-d-hf-tokensecret in your target namespace with the keyHF_TOKENmatching a valid HuggingFace token to pull models.
export HF_TOKEN=<your HuggingFace token>
kubectl create secret generic llm-d-hf-token \
  --from-literal="HF_TOKEN=${HF_TOKEN}" \
  --namespace "${NAMESPACE}" \
  --dry-run=client -o yaml | kubectl apply -f -
Installation Instructions
1. Deploy the Router
(Optional) Enable Prometheus monitoring on the router (requires installing the Monitoring stack first; see Enable monitoring):
export EXTRA_HELM_ARGS="--values=${REPO_ROOT}/guides/recipes/router/features/monitoring.values.yaml"
Standalone Mode
This deploys the router with an Envoy sidecar, it doesn't set up a Kubernetes Gateway.
helm upgrade --install ${GUIDE_NAME} \
    ${ROUTER_STANDALONE_CHART} \
    -f ${REPO_ROOT}/guides/recipes/router/base.values.yaml \
    -f ${ROUTER_VALUES} \
    ${EXTRA_HELM_ARGS} \
    -n ${NAMESPACE} --version ${ROUTER_CHART_VERSION}
The router pod's resource requests are set in
base.values.yaml: 4 vCPU and 8 GiB of memory for
each of the EPP and Envoy containers, so 8 vCPU and 16 GiB per pod. A pod stuck Pending
with Insufficient cpu needs a node with the pod's full CPU request allocatable.
Gateway Mode
To use a Kubernetes Gateway managed proxy rather than the standalone version, follow these steps instead of applying the previous Helm chart:
- Deploy a Kubernetes Gateway named
llm-d-inference-gatewayby following one of the gateway guides. - Deploy the router and an HTTPRoute that connects it to the Gateway as follows:
export PROVIDER_NAME=gke # options: none, gke, agentgateway, istio
helm upgrade --install ${GUIDE_NAME} \
    ${ROUTER_GATEWAY_CHART} \
    -f ${REPO_ROOT}/guides/recipes/router/base.values.yaml \
    -f ${REPO_ROOT}/guides/recipes/router/features/httproute-flags.yaml \
    -f ${ROUTER_VALUES} \
    ${EXTRA_HELM_ARGS} \
    --set provider.name=${PROVIDER_NAME} \
    -n ${NAMESPACE} --version ${ROUTER_CHART_VERSION}
2. Deploy the Model Server
Instead of maintaining duplicate hardware configurations, we dynamically render the model server manifests from the optimized-baseline guide and inject the flow-control guide labels using sed.
Deploy the model server (defaulting to NVIDIA GPU / vLLM) by running:
kubectl kustomize ${REPO_ROOT}/guides/optimized-baseline/modelserver/gpu/vllm/${INFRA_PROVIDER}/ \
  | sed "s/optimized-baseline/${GUIDE_NAME}/g" \
  | kubectl apply -n ${NAMESPACE} -f -
AMD ROCm
Flow Control also runs on the Optimized Baseline guide's AMD vLLM model server
(2 replicas, TP=2, Qwen/Qwen3-32B on AMD Instinct MI355X). Render the AMD
overlay and relabel it for this guide:
export INFRA_PROVIDER=base

kubectl kustomize ${REPO_ROOT}/guides/optimized-baseline/modelserver/amd/vllm/${INFRA_PROVIDER}/ \
  | sed "s/optimized-baseline/${GUIDE_NAME}/g" \
  | kubectl apply -n ${NAMESPACE} -f -
Intel XPU
Flow Control also runs on the Optimized Baseline guide's Intel XPU model server (2 × vLLM, one Intel Data Center GPU Max 1550+ per pod, Qwen/Qwen3-0.6B). Its CI runners are single-XPU-per-pod, so it does not carry the GPU path's TP=2 / Qwen3-32B configuration — the Default Configuration table above does not apply as-is; use Qwen/Qwen3-0.6B and 2 replicas for this path instead. Override MODEL_NAME before deploying, since every verification/benchmark command below sends its request to ${MODEL_NAME}, and the default (Qwen/Qwen3-32B) is not the model this overlay loads:
export MODEL_NAME="Qwen/Qwen3-0.6B"

kubectl kustomize ${REPO_ROOT}/guides/optimized-baseline/modelserver/xpu/vllm/ \
  | sed "s/optimized-baseline/${GUIDE_NAME}/g" \
  | kubectl apply -n ${NAMESPACE} -f -
Wait for the router deployment (${GUIDE_NAME}-epp) and the model server deployments (-l llm-d.ai/guide=${GUIDE_NAME}, e.g., flow-control-nvidia-gpu-vllm-decode) to become Available before continuing (Qwen/Qwen3-32B takes several minutes to download weights and compile graphs):
kubectl wait --for=condition=Available deployment/${GUIDE_NAME}-epp -n ${NAMESPACE} --timeout=300s
kubectl wait --for=condition=Available deployment -l llm-d.ai/guide=${GUIDE_NAME} -n ${NAMESPACE} --timeout=1800s
3. Enable monitoring (optional)
If you want Prometheus scraping via ServiceMonitor and PodMonitor, the Monitoring stack must be installed in the cluster so those CRDs exist:
- Set
export EXTRA_HELM_ARGS="--values=${REPO_ROOT}/guides/recipes/router/features/monitoring.values.yaml"before running the router installation command (or re-runhelm upgrade --installwithEXTRA_HELM_ARGSset if you already deployed the router without it). - Set
export MONITORING=trueto deploy the monitoring resources (PodMonitor) for the model servers:
# only when MONITORING=true:
kubectl apply -n ${NAMESPACE} -k ${REPO_ROOT}/guides/recipes/modelserver/components/monitoring
Verification
1. Get the IP of the Proxy
Standalone Mode
export IP=$(kubectl get service ${GUIDE_NAME}-epp -n ${NAMESPACE} -o jsonpath='{.spec.clusterIP}')
Gateway Mode
export IP=$(kubectl get gateway llm-d-inference-gateway -n ${NAMESPACE} -o jsonpath='{.status.addresses[0].value}')
2. Basic Verification
Check EPP logs for feature gate activation:
# -c epp: in standalone mode kubectl defaults to the Envoy sidecar, whose log never matches
kubectl logs deploy/${GUIDE_NAME}-epp -c epp -n ${NAMESPACE} | grep "Initializing Flow Control layer"
Expected: one line, Initializing Flow Control layer. No output means the gate is off for
this deployment (the EPP then logs Flow Control layer is disabled instead) or the log
format changed; the stronger check is that llm_d_epp_flow_control_* series exist on the
metrics endpoint (see Proof of Queuing).
3. Proof of Queuing
To fully verify that queuing and backpressure are working, you must apply concurrent load; Use Case 2 does that with a burst of concurrent requests. For now, set up the test environment.
Read maxConcurrency from router/flow-control.values.yaml.
The Use Case 2 load test sizes its burst from MAX_CONCURRENCY; a retuned values file
changes the burst with it:
MAX_CONCURRENCY=$(awk '$1 == "maxConcurrency:" {print $2; n++} END {exit n!=1}' \
    ${ROUTER_VALUES}) \
  || echo "expected exactly one maxConcurrency: in the values file" >&2
export MAX_CONCURRENCY
echo "maxConcurrency: ${MAX_CONCURRENCY}"   # expect the integer set in the values file
Grant read access to the EPP metrics endpoint. By default (router.monitoring.prometheus.auth.enabled: true), the EPP authenticates every metrics scrape against the Kubernetes API: a TokenReview on the caller's bearer token, then a SubjectAccessReview on the /metrics URL (note: if you enabled monitoring.values.yaml in Step 1, it sets --metrics-endpoint-auth=false, making the RBAC grants below a harmless no-op). While the Helm chart grants the EPP's service account (${GUIDE_NAME}-epp) permission to run those reviews, it only adds the /metrics reader rule when router.monitoring.prometheus.enabled is set (which also creates a ServiceMonitor), and binds it to ${GUIDE_NAME}-epp rather than default. Grant the debug pod's default service account permission to read /metrics (and bind system:auth-delegator to ${GUIDE_NAME}-epp as a fallback if chart RBAC was disabled):
kubectl create clusterrole ${GUIDE_NAME}-metrics-reader \
    --verb=get --non-resource-url=/metrics \
    --dry-run=client -o yaml | kubectl apply -f -
kubectl create clusterrolebinding ${GUIDE_NAME}-metrics-reader \
    --clusterrole=${GUIDE_NAME}-metrics-reader \
    --serviceaccount=${NAMESPACE}:default \
    --dry-run=client -o yaml | kubectl apply -f -
kubectl create clusterrolebinding ${GUIDE_NAME}-epp-auth-delegator \
    --clusterrole=system:auth-delegator \
    --serviceaccount=${NAMESPACE}:${GUIDE_NAME}-epp \
    --dry-run=client -o yaml | kubectl apply -f -
Without the ${GUIDE_NAME}-metrics-reader grant (when metrics auth is enabled), the metrics endpoint returns 403 Forbidden, and every metrics check in this guide reads as empty grep output.
Open a temporary interactive shell inside the cluster:
kubectl run curl-debug --rm -it \
    --image=cfmanteiga/alpine-bash-curl-jq \
    --namespace="$NAMESPACE" \
    --env="IP=$IP" \
    --env="NAMESPACE=$NAMESPACE" \
    --env="GUIDE_NAME=$GUIDE_NAME" \
    --env="MODEL_NAME=$MODEL_NAME" \
    --env="MAX_CONCURRENCY=$MAX_CONCURRENCY" \
    -- /bin/bash
From inside the debug pod, check the metrics. The pod's automounted service account token authenticates the scrape:
TOKEN=$(cat /var/run/secrets/kubernetes.io/serviceaccount/token)
curl -s -o metrics.txt -w "%{http_code}\n" -H "Authorization: Bearer ${TOKEN}" \
  http://${GUIDE_NAME}-epp:9090/metrics   # expect: 200
grep llm_d_epp_flow_control_pool_saturation metrics.txt
Expected: stage="decode" and stage="effective" series for the pool, both 0 on an
idle pool (confirming the Flow Control layer is active and exporting metrics; a
disaggregated pool also exports stage="prefill"; per-flow
series such as llm_d_epp_flow_control_queue_size are registered lazily after a flow
receives its first request). A 401 means the request carried no valid token; a 403
means the ${GUIDE_NAME}-metrics-reader grant above was skipped; a 500 means the EPP's
service account lacks the auth-delegator binding (the EPP log shows a failed TokenReview).
Use Cases
Use Case 1: Multi-Tenancy (Model-as-a-Service)
In this use case, we configure 3 priority tiers (Premium, Standard, Best-Effort) and guarantee fairness between tenants within the same tier.
1. Apply InferenceObjectives
The helm upgrade --install command you ran earlier configured the EPP's underlying EndpointPickerConfig to map queues to priority bands. However, you must explicitly define these bands in the cluster using InferenceObjective resources.
From your host terminal (keep the curl-debug shell open in another tab), apply the full definitions (Premium, Standard, Best-Effort) provided in objectives.yaml by running:
kubectl apply -f ${REPO_ROOT}/guides/${GUIDE_NAME}/objectives.yaml -n ${NAMESPACE}
The file defines three priority tiers:
- Premium (priority 100): Highest priority.
- Standard (priority 0): Default priority.
- Best-Effort (priority -10): Admitted into queue but subject to strict band limits.
2. Client Integration
Clients must send the appropriate headers to be placed in the correct queues.
From inside the curl-debug pod, send a completion request with headers:
curl -X POST http://${IP}/v1/completions \
  -H 'Content-Type: application/json' \
  -H 'x-llm-d-inference-fairness-id: tenant-a' \
  -H 'x-llm-d-inference-objective: premium-traffic' \
  -d "{
    \"model\": \"${MODEL_NAME}\",
    \"prompt\": \"Say hello\"
  }"
Trust Boundary: In a production system, allowing end-users to self-assert their tenant ID or traffic priority (premium-traffic) is an abuse vector.
Production Pattern: Your ingress API Gateway (or an Envoy ext_authz filter) should be configured to automatically strip any incoming x-llm-d-* headers, plus the deprecated EPP-managed aliases listed in the EPP HTTP headers reference, from external traffic. Gateway API Inference Extension (GAIE) endpoint picker protocol headers such as x-gateway-destination-endpoint* are not part of this stripping rule. After stripping, validate the user's API Key or JWT, extract their tier/tenant from the token claims, and securely inject the authoritative x-llm-d-inference-fairness-id and x-llm-d-inference-objective headers before passing the request to the EPP.
3. Verify the Classification
Still inside the curl-debug pod, confirm the request was accounted under the premium
band:
TOKEN=$(cat /var/run/secrets/kubernetes.io/serviceaccount/token)
curl -s -H "Authorization: Bearer ${TOKEN}" http://${GUIDE_NAME}-epp:9090/metrics \
  | grep 'llm_d_epp_flow_control_request_queue_duration_seconds_count' \
  | grep 'priority="100"'
Expected: a series labeled fairness_id="tenant-a", priority="100" with a count of at
least 1. If it is absent while a priority="0" series grows, the objective headers are
not being honored. Check that objectives.yaml is applied and that its poolRef (or poolRefs in v1)
matches the InferencePool in the namespace (kubectl get inferencepools -n ${NAMESPACE}).
Use Case 2: Backpressure Management
Backpressure management protects GPUs from context-thrashing and ensures predictable generation times by holding requests in the EPP when the pool is saturated.
Unlike legacy admission mode which immediately drops negative-priority requests when the pool is full, Flow Control safely buffers them. Load shedding is triggered strictly by memory protection boundaries—meaning a request is only rejected if its specific priority band hits its maxRequests limit, OR if the global limits (maxRequests or maxBytes) are breached.
Verification for Use Case 2
To verify backpressure management, you must overwhelm the pool's capacity. Because the system is work-conserving, a single request will dispatch immediately. We will fire a sustained burst of concurrent curl requests to trigger saturation.
-
Create a payload that sustains load (from inside the
curl-debugpod). A short prompt with the defaultmax_tokenscompletes in under a second and drains before any queue is observable, so build one that keeps each request busy for tens of seconds:awk 'BEGIN{s=""; for(i=0;i<1500;i++) s=s" " int(rand()*32000); print s}' \| jq -Rs "{model: \"${MODEL_NAME}\", prompt: ., max_tokens: 500, ignore_eos: true}" \> payload.json -
Fire a burst of Best-Effort requests in the background. Queuing begins only once in-flight requests exceed the pool's dispatch capacity:
maxConcurrency× ready model-server replicas. Scale the pool to a single replica so a shell loop can exceed that capacity, and record the current replica count for step 5 to restore. The debug pod has no kubectl, so run the scale commands from your host terminal:export ORIG_REPLICAS=$(kubectl get deployment -l llm-d.ai/guide=${GUIDE_NAME} \-n ${NAMESPACE} -o jsonpath='{.items[0].spec.replicas}')kubectl scale deployment -l llm-d.ai/guide=${GUIDE_NAME} -n ${NAMESPACE} --replicas=1Wait for the scale-down to settle. While more than one replica reports ready, dispatch capacity stays above
MAX_CONCURRENCYand the burst drains without queuing:until [ "$(kubectl get deployment -l llm-d.ai/guide=${GUIDE_NAME} \-n ${NAMESPACE} -o jsonpath='{.items[0].status.readyReplicas}')" = "1" ]; dosleep 5doneBack in the debug pod, confirm a single request succeeds before bursting; a failing payload would read as an empty queue in step 3. The request generates 500 tokens and takes several seconds on an unloaded pool:
curl -s -o /dev/null -w "%{http_code}\n" --max-time 600 -X POST \-H "Content-Type: application/json" \-H "x-llm-d-inference-fairness-id: tenant-b" \-H "x-llm-d-inference-objective: best-effort-traffic" \-d @payload.json http://${IP}/v1/completions # expect: 200Then fire the burst:
MAX_CONCURRENCYrequests dispatch immediately andSURPLUSrequests queue. KeepSURPLUSbelow the best-effort band'smaxRequestslimit in router/flow-control.values.yaml; past that limit the EPP rejects the overflow. The burst must still be running when you poll in step 3, so background each request (&):SURPLUS=20 # requests expected to queue; stay below the band's maxRequestsBURST=$((MAX_CONCURRENCY + SURPLUS))for i in $(seq 1 ${BURST}); docurl -s -o /dev/null --max-time 600 -X POST \-H "Content-Type: application/json" \-H "x-llm-d-inference-fairness-id: tenant-b" \-H "x-llm-d-inference-objective: best-effort-traffic" \-d @payload.json http://${IP}/v1/completions &done -
Observe behavior while the load runs. The surplus requests buffer in the
best-effortpriority band. Poll the queue-size metric for the duration of the load and record the peak:TOKEN=$(cat /var/run/secrets/kubernetes.io/serviceaccount/token)PEAK=0for i in $(seq 1 30); doQ=$(curl -s -H "Authorization: Bearer ${TOKEN}" http://${GUIDE_NAME}-epp:9090/metrics \| awk '/llm_d_epp_flow_control_queue_size.*priority="-10"/ {s+=$2} END {print s+0}')[ "$Q" -gt "$PEAK" ] && PEAK=$Qsleep 1doneecho "peak best-effort queue depth: ${PEAK} (expected ~${SURPLUS})"wait # let the burst finish before moving onExpect a peak near
SURPLUS: the burst minus theMAX_CONCURRENCYrequests that dispatched immediately. A peak above 0 confirms the EPP queued the surplus. A peak of 0 usually means the metrics scrape failed auth (re-run the metrics check from Proof of Queuing; expect 200), the poll missed the load window (the burst finished first; raisemax_tokens), or the burst never exceeded dispatch capacity (more than one replica still ready; re-check the scale-down in step 2). Rule out all three causes before raising the concurrency and re-running.waitreturns once the pool works through the burst: about 30 seconds on the reference workload's single replica, longer on slower pools. On a pool slow enough that queued requests wait pastdefaultRequestTTL(60s in router/flow-control.values.yaml), the EPP rejects them. The burst curls discard their responses, so a rejection leaves no output; the poll records the peak in the first seconds of the burst, before any TTL can expire. -
Exit the debug shell once testing is complete to return to your host terminal:
exit -
Restore the model server replica count recorded in step 2 and wait for the rollout to complete (model server pods take several minutes to download weights and compile graphs):
kubectl scale deployment -l llm-d.ai/guide=${GUIDE_NAME} -n ${NAMESPACE} --replicas=${ORIG_REPLICAS}kubectl rollout status deployment -l llm-d.ai/guide=${GUIDE_NAME} -n ${NAMESPACE} --timeout=1800s
Production Tuning: Deriving maxConcurrency
The maxConcurrency value shipped in router/flow-control.values.yaml is a per-replica threshold empirically tuned only for the default reference workload (Qwen/Qwen3-32B on H100 80 GB, TP=2 — 2 GPUs per replica). If you use a different model, hardware, or have different prompt lengths, you must calculate your own maxConcurrency to prevent GPU starvation or OOMs.
For detailed instructions on how to derive the optimal maxConcurrency for your specific workload, see the Tune Flow Control Concurrency.
Benchmarking
This guide uses llmdbenchmark — the supported standard CLI for llm-d performance benchmarking.
In this example we will demonstrate how to run inference-perf with a generic load workload against the stack you just deployed above (standalone or gateway mode). When orchestrating benchmarks via llmdbenchmark, the CLI automatically and transparently deploys a harness pod (llmdbench-harness-launcher) into your namespace. This pod is central to driving the workload, collecting the results, and tearing itself down when it's finished.
For more in-depth explanation and features for benchmarking llm-d guides, see docs/operations/validation/benchmark.md.
The Benchmarking section below contains only the flow-control-specific commands needed to drive the stack you just deployed — for everything else (and especially when something goes wrong), start at docs/operations/validation/benchmark.md.
For even more details about benchmarking, see the actual repository: llm-d-benchmark on GitHub.
Benchmarking flow-control's QoS differentiation and fairness behaviors requires a specialized multi-tenant load harness that does NOT yet ship in llm-d-benchmark or inference-perf. The command below exercises the stack under load and validates the end-to-end path, but it does NOT measure QoS slicing across priority classes or tenant isolation. A dedicated guide_flow-control_1.yaml will be added upstream once multi-tenant load shaping is supported.
To run a simpler workload with fewer execution cycles first (useful for validating the path, image pulls, PVC binding, etc. before committing to a real run), pick a sanity_*.yaml profile (e.g. sanity_random.yaml) as described in docs/operations/validation/benchmark.md → Available workload profiles and substitute it for the --workload flag in the command below.
1. Install the llmdbenchmark CLI
Automatically clone the benchmark repository into ./llm-d-benchmark/ and create a virtualenv at ./llm-d-benchmark/.venv/ containing dependencies and its installation:
curl -sSL https://raw.githubusercontent.com/llm-d/llm-d-benchmark/main/install.sh | bash
Activate the venv and enter the repository directory - both are required: the venv puts llmdbenchmark on your PATH, and the repository directory contains the workload/profiles/ and config/specification/ files that orchestrate the benchmark:
cd llm-d-benchmark
source .venv/bin/activate
llmdbenchmark --version
Subsequent llmdbenchmark commands in this section assume you are inside the llm-d-benchmark repo directory with the venv activated. If you open a new shell, re-run the two commands above.
2. Resolve the endpoint of the stack you just deployed
Set two variables so the rest of the section is topology-agnostic: the endpoint URL and the gateway class. The gateway class tells the CLI which deployment topology the cluster is actually running, without this, the CLI re-renders against the benchmark scenario's default values.
Standalone Mode (the default in this guide — no Kubernetes Gateway, EPP pod with an Envoy sidecar):
export ENDPOINT_URL="http://$(kubectl get service ${GUIDE_NAME}-epp -n ${NAMESPACE} -o jsonpath='{.spec.clusterIP}')"
export GATEWAY_CLASS=epponly # standalone mode
Gateway Mode
export ENDPOINT_URL="http://$(kubectl get gateway llm-d-inference-gateway -n ${NAMESPACE} -o jsonpath='{.status.addresses[0].value}')"

# Match whichever provider you used when deploying the gateway (e.g. istio, agentgateway, gke).
export GATEWAY_CLASS=istio
3. Run the benchmark profile for Flow Control
Benchmark results are copied to the workspace directory that is specified by you (or that is automatically generated when omitted from the cli) on the machine running the CLI. The workspace location is optional — by default the CLI auto-generates a timestamped workspace and prints its full path in the logs during the run. If you'd rather choose where results land, pass --workspace <YOUR_DIR_HERE> as a top-level argument of llmdbenchmark (before the run subcommand):
llmdbenchmark \
    --spec           guides/flow-control \
    run \
    --endpoint-url   "${ENDPOINT_URL}" \
    --gateway-class  "${GATEWAY_CLASS}" \
    --model          "${MODEL_NAME}" \
    --namespace      "${NAMESPACE}" \
    --harness        inference-perf \
    --workload       random_concurrent.yaml \
    --analyze
The harness pod requests 16 vCPU by default
(resource requirements),
and its workload-pvc requires a ReadWriteMany-capable StorageClass. If the run stalls on a Pending pod or a PVC
timeout, see Troubleshooting in docs/operations/validation/benchmark.md
for the StorageClass override (including a GKE Filestore walkthrough) and the
timeout knobs.
Observability
The Flow Control layer exposes detailed metrics to track queuing dynamics. Please refer to flow control architecture for more details.
Cleanup
To remove the deployed components:
helm uninstall ${GUIDE_NAME} -n ${NAMESPACE}

kubectl delete -f ${REPO_ROOT}/guides/${GUIDE_NAME}/objectives.yaml -n ${NAMESPACE} --ignore-not-found=true

# INFRA_PROVIDER must match the value used at deploy time. This command
# cleans up the default NVIDIA GPU deployment; the AMD ROCm and Intel XPU
# alternatives are documented immediately below this generated block.
kubectl kustomize ${REPO_ROOT}/guides/optimized-baseline/modelserver/gpu/vllm/${INFRA_PROVIDER}/ \
  | sed "s/optimized-baseline/${GUIDE_NAME}/g" \
  | kubectl delete -n ${NAMESPACE} -f - --ignore-not-found=true

# only when MONITORING=true:
kubectl delete -n ${NAMESPACE} -k ${REPO_ROOT}/guides/recipes/modelserver/components/monitoring --ignore-not-found=true

kubectl delete clusterrolebinding ${GUIDE_NAME}-metrics-reader ${GUIDE_NAME}-epp-auth-delegator --ignore-not-found=true
kubectl delete clusterrole ${GUIDE_NAME}-metrics-reader --ignore-not-found=true
kubectl delete namespace ${NAMESPACE}
If you deployed on AMD ROCm, use this model-server cleanup command instead of
the NVIDIA GPU command above (INFRA_PROVIDER must match the value used at
deploy time):
kubectl kustomize ${REPO_ROOT}/guides/optimized-baseline/modelserver/amd/vllm/${INFRA_PROVIDER}/ \
  | sed "s/optimized-baseline/${GUIDE_NAME}/g" \
  | kubectl delete -n ${NAMESPACE} -f - --ignore-not-found=true
If you deployed on Intel XPU, use this model-server cleanup command instead
(the XPU overlay has no INFRA_PROVIDER split):
kubectl kustomize ${REPO_ROOT}/guides/optimized-baseline/modelserver/xpu/vllm/ \
  | sed "s/optimized-baseline/${GUIDE_NAME}/g" \
  | kubectl delete -n ${NAMESPACE} -f - --ignore-not-found=true
If you ran the Benchmarking section before deleting the namespace, also delete the harness leftovers. The workload PVC
is backed by shared storage that bills until removed. Follow
Cleaning up benchmark resources in docs/operations/validation/benchmark.md
with <namespace> set to ${NAMESPACE}.
Further Reading
See Flow Control architecture for full details of the design.