Multi-Tenant Async Processing — Quota, Priority & Saturation


An advanced Async Processor scenario built on the
asynchronous-processing guide, across two dimensions — team × tier — for one model served by one llm-d Router
InferencePool. Each team gets a per-team quota (reserved vs. overflow) and a priority tier; the
worker pool backs off when the pool saturates (saturation-aware back-off), observed through self-hosted
Prometheus + Grafana (or GCP Cloud Monitoring on the Pub/Sub backend).
The scenario is the point; the message queue is a pluggable backend — it runs unchanged on Redis SortedSet (the default here) or GCP Pub/Sub. The gate configuration, worker pools, and scenario walkthroughs are identical across both; only the queue wiring and how you publish differ.
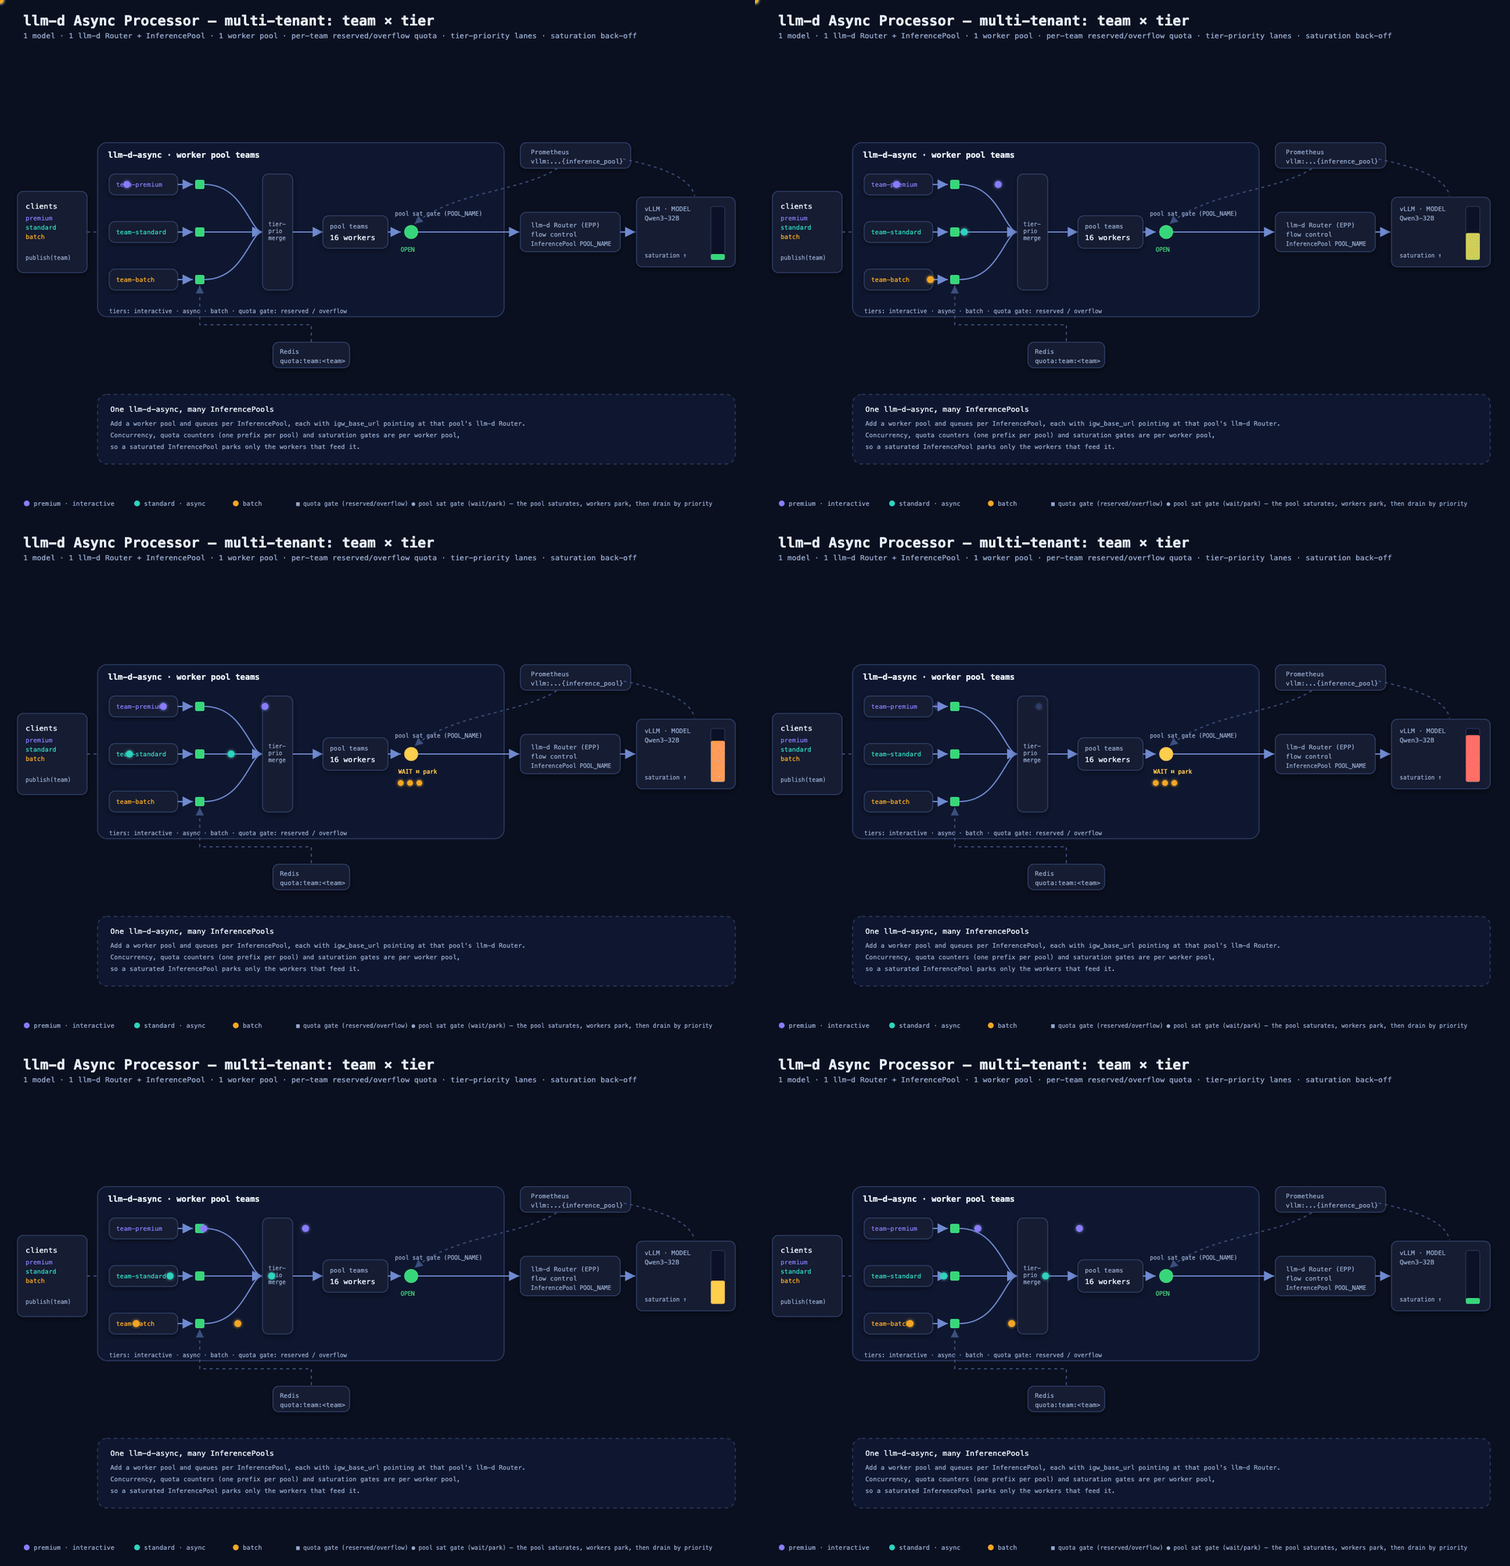
Source + regeneration for the diagram: diagram/ (architecture.html is the editable
animated SVG).
Overview
The demo serves one model (Qwen/Qwen3-32B) behind one llm-d Router and InferencePool (llm-d-router).
Three teams contend for it by tier and quota through 3 queues and one worker pool in
llm-d-async:
| Worker Pool | Team | Queue (Redis) | Tier | Reserved quota |
|---|---|---|---|---|
teams (16 workers) | premium | team-premium | interactive | concurrency 2 |
| standard | team-standard | async | concurrency 2 | |
| batch | team-batch | batch | concurrency 1 |
One llm-d-async, many InferencePools. This walkthrough uses one model and one pool to stay small, but one
llm-d-async deployment can feed many InferencePools independently. Give each pool its own worker pool
(workerPools[].id) and its own queues, with igw_base_url pointing at that pool's llm-d Router. Worker
concurrency, quota counters (use a distinct quota prefix per pool) and saturation gates are all per worker
pool, so saturating one InferencePool parks only the workers that feed it. Each pool also needs its own set
of InferenceObjectives (see step 2).
How requests are classified:
- Queue as the serving dimension (tier). A queue represents a serving tier
(e.g., interactive latency-sensitive, standard async, or batch throughput), not a rigid single-tenant silo.
In production, multiple distinct teams can publish into the same queue concurrently. The request payload
identifies the team via
metadata.team. - Team → reservation classification. The per-team
redis-quotagate runs inclassifyingmode (keyed dynamically onmetadata.team, asquota:team:<team>): each team maintains its own independent concurrency counter in Redis. When multiple teams share a serving queue, one team exceeding its quota does not exhaust another team's budget: within quota →reserved(org-guaranteed), over quota →overflow(admitted and deprioritized, not nacked). - Tier → priority. A per-queue
tierlabel:interactive(premium tier) >async(standard tier) >batch.
The tier-priority merge policy runs
per worker pool: it buckets requests into 6 strict lanes by
(classification, tier), dispatches them in order, and stamps x-llm-d-inference-objective via lane_objectives.
By defining matching InferenceObjective
resources in the cluster, llm-d-async and llm-d Router Flow Control speak the exact same language.
Requests carry the authoritative objective and tenant identity (x-llm-d-inference-fairness-id), allowing
llm-d Router to enforce multi-tenant fairness and priority band admission:
| Lane | Objective (lane_objectives) | Header x-llm-d-inference-objective | Router Band Priority | Who |
|---|---|---|---|---|
| reserved + interactive | reserved-interactive | reserved-interactive | 100 | premium within quota |
| reserved + async | reserved-async | reserved-async | 60 | standard within quota |
| reserved + batch | reserved-batch | reserved-batch | 30 | batch within quota |
| overflow + interactive | overflow-interactive | overflow-interactive | 10 | premium over quota |
| overflow + async | overflow-async | overflow-async | -5 | standard over quota |
| overflow + batch | overflow-batch | overflow-batch | -10 | batch over quota |
So all reserved traffic drains before any overflow (org priority), tier-ordered within each class. On Redis SortedSet, within a lane dispatch is earliest-deadline-first (the deadline is the sorted-set score).
Priority Values: Flow Control ON vs. Flow Control OFF
Downstream priority is propagated via lane objective stamping (x-llm-d-inference-objective), which maps each request to a Kubernetes InferenceObjective resource where higher numerical values represent higher scheduling priority (100 down to -10).
With Flow Control ON (llm-d Router)
When llm-d Router is deployed with Flow Control enabled (featureGates: [flowControl] in the router values under values/router/):
- Centralized Priority Bands: When model server capacity saturates (detected in real time via
concurrency-detectororutilization-detector), requests are held in memory across priority bands matching theInferenceObjectivepriority (100, 60, 30, 10, -5, -10). - Strict Band Dispatch: llm-d router drains highest-priority bands first: all
reservedbands (100, 60, 30) dispatch before anyoverflowband (10, -5, -10) is admitted. - Band Capacity & Drops on Full Bands: Each priority band enforces isolated buffer limits via
maxRequestsandmaxBytes. When a priority band reaches capacity, new incoming requests for that band are dropped immediately (HTTP 429) regardless of that band's priority. A high priority level does not grant unbounded buffer capacity; an overloaded priority 100 band drops its own incoming traffic rather than evicting queued requests from other bands. - Retries with Backoff in
llm-d-async: Requests dropped or rejected by router flow control (e.g., when a priority band is full or during in-flight eviction, returning HTTP 429) are caught byllm-d-asyncand retried with exponential backoff and jitter provided the request's deadline has not expired. - Multi-Tenant Fairness: Within any single priority band, the router enforces tenant fairness (
round-robin-fairness-policyoverx-llm-d-inference-fairness-id, which is stamped frommetadata.team). No single tenant can monopolize a priority tier. - Order Preservation: Within each tenant's individual flow, requests dispatch in arrival order (
fcfs-ordering-policy). - Priority Holdback (
priority-holdback-policy, in this guide'sflow-control-holdback.yaml): As the pool saturates, each lower priority band is admitted only up to a ceiling below full capacity, so headroom stays free for higher-priority traffic. Nothing already running is cancelled. See Protecting realtime traffic. - In-Flight Eviction (
enableEviction: true, the default in this guide'sflow-control-evictable.yaml): When eviction is enabled for Flow Control, only negative-priority in-flight requests (priority < 0:overflow-asyncat-5andoverflow-batchat-10, lowest priority first) can be canceled and evicted after already being sent to the model server. While standard gated dispatch only holds back newly arriving work, in-flight eviction actively reclaims occupied GPU compute and KV cache from sheddable background requests when higher-priority traffic is blocked by pool saturation. Evicted requests are retried byllm-d-asyncand redo their generation. See Protecting realtime traffic. - For detailed architecture, lifecycle, and policy plugins, see the Flow Control Documentation.
With Flow Control OFF (Baseline Router with Saturation Detection)
When llm-d Router operates in standard baseline mode (without the flowControl feature gate):
- Pass-Through Scheduling: The router does not maintain priority band queues or tenant fairness buffers.
- Immediate Rejection of Sheddable Requests: When the pool is saturated, "sheddable" requests (those with negative priority,
priority < 0:overflow-asyncandoverflow-batch) are immediately rejected with HTTP 429 (Too Many Requests). All other requests pass directly to the model servers and are scheduled via baseline routing plugins (such asprefix-cache-scorerandqueue-scorer). - Retries with Backoff in
llm-d-async: Requests dropped or rejected are caught byllm-d-asyncand retried with exponential backoff and jitter provided the request's deadline has not expired. - Saturation Telemetry: The router still exposes real-time pool saturation metrics (
llm_d_epp_flow_control_pool_saturationor vLLM metrics). - Upstream Priority & Backpressure in
llm-d-async: Priority enforcement shifts entirely upstream to the Async Processor:- The
tier-prioritymerge policy ensures that allreservedrequests are dequeued and dispatched beforeoverflowtraffic, and higher tiers dispatch before lower tiers. - When downstream saturation is detected via Prometheus, the worker pool gate (
wait-on-refuseortier-priority-admission) intervenes directly inllm-d-asyncby parking workers in-memory (ActionWait), refusing messages (ActionRefuse), or dropping them (ActionDrop). - As a result, model servers remain protected against overload even without router-side priority queuing.
- The
With Flow Control OFF (Baseline Router without Saturation Detection)
When saturation detection is disabled (no saturation detector configured in llm-d Router) every request is immediately dispatched to available model servers regardless of its assigned priority value.
Protecting realtime traffic
When realtime (interactive) requests share an InferencePool with llm-d-async traffic, priority bands alone
do not keep them fast. Async work fills the pool up to the router's maxConcurrency (and, under a backlog,
past it), so a realtime request that arrives at a full pool waits in flow control until an async request
finishes: a full request duration
(measurements). Either priority holdback or in-flight
eviction is required to protect realtime traffic mixed with llm-d-async traffic. The guide provides one
router values file for each:
In-flight eviction (flow-control-evictable.yaml, default, recommended) | Priority holdback (flow-control-holdback.yaml) | |
|---|---|---|
| How | Lets async work fill the pool, then cancels in-flight overflow-async / overflow-batch requests when a higher-priority request is blocked | Admits each lower band only up to a ceiling (here falling from 100 % of capacity for priority 100 to 50 % for overflow-batch), keeping headroom free for higher bands |
| Realtime latency | Protected | Protected, as long as the reserved headroom is larger than the router's admission burst (minCeiling: 0.5; 0.7 and 0.9 were not enough) |
| Async efficiency | Full async throughput while realtime is quiet; evicted requests are retried and their partial work is lost (6 to 9 % of the tokens processed) | The headroom stays idle while realtime traffic is quiet: async throughput was 26 % lower (48 % with shared prompt prefixes) |
The tradeoff with holdback is between protecting realtime traffic and async efficiency: a lower minCeiling
reserves more headroom, which protects realtime traffic against larger admission bursts but leaves more
capacity idle when realtime traffic is quiet; a higher one does the opposite. The figures above come from
llm-d-async#468 (Qwen3-8B on one L4 and Qwen3-32B on two
H100s, router capacity 10); measure your own traffic before tuning.
Over-quota is deprioritized, not dropped. In classifying mode, requests beyond a team's
reserved quota become overflow and are dispatched after all reserved traffic, rather than
nacked/redelivered. To hard-throttle instead, set gate_params.gating_mode: blocking (over-quota
returns to the queue; backlog grows).
Prerequisites
This guide layers on the base asynchronous-processing guide — complete its
Prerequisites first (through the
optimized-baseline guide they cover the client tools, the cluster,
the GAIE CRDs and the HF-token secret), source guides/env.sh, then add the following.
-
llm-d router with Flow Control. This guide uses llm-d Router configured with Flow Control enabled rather than the standard baseline router. Flow Control assigns incoming requests to priority bands based on the
InferenceObjectiveCRD referenced by each request. -
InferenceObjective CRD and Resources. Requests dispatched by
llm-d-asynccarry thex-llm-d-inference-objectiveheader matching the request's priority lane. You must install theInferenceObjectiveCRD and define the objective resources in your cluster matching yourInferencePool. -
Hardware. The default model server is one replica of
Qwen/Qwen3-32Bwith tensor parallelism 2: two NVIDIA GPUs with 80 GB of memory each (for example H100 or A100 80GB), and a node with 8 CPUs and 96 GiB of memory free for the pod. On a single GPU (for example one L4), use the single-GPU override, which servesQwen/Qwen3-8Binstead. -
Model Serving Stack & Router. The walkthrough deploys a single llm-d Router instance (which creates the llm-d Router InferencePool) and a single vLLM model server serving
Qwen/Qwen3-32Bon two GPUs (tensor parallelism 2).
Get the guide
Every command below runs from a local clone of the llm-d repository: the manifests, Helm values, and Kustomize overlays it applies live next to this guide. Set the branch and clone the repo (if you already have a checkout, skip this and run the remaining commands from inside it):
export BRANCH=main
git clone https://github.com/llm-d/llm-d.git && cd llm-d && git checkout ${BRANCH}
Then set this guide's environment (on top of the base guide's variables). GPUS, FLOW_CONTROL and
QUEUE_BACKEND select the alternatives described in the steps below:
export REPO_ROOT=$(realpath $(git rev-parse --show-toplevel))
export MT=${REPO_ROOT}/guides/batch-serving/asynchronous-processing/multitenant
export NAMESPACE=llm-d-async
export ASYNC_VERSION=v1.0.0 # llm-d-async release (supports lane_objectives & tier-priority)
export INFRA_PROVIDER=base # options: base, gke; model server overlay variant
export GPUS=2 # options: 2, 1; GPUs for the model server; 1 serves Qwen/Qwen3-8B instead
export FLOW_CONTROL=evictable # options: evictable, holdback; router values: in-flight eviction (recommended), or priority holdback
export QUEUE_BACKEND=redis # options: redis, pubsub
export MONITORING=false # options: false, true; router EPP ServiceMonitor; needs the monitoring stack, required for Scenarios C and D
export MONITORING_VALUES=
export POOL_NAME=llm-d-router # constant: the router release and its InferencePool (objectives, PodMonitor, saturation gates)
export MODEL=Qwen/Qwen3-32B # served model name (goes in payload.model)
export PROM_URL=http://llmd-kube-prometheus-stack-prometheus.llm-d-monitoring.svc.cluster.local:9090 # Scenarios C and D only: the Prometheus the saturation gates read
export SAT_CAP=4 # Scenario C only: concurrent requests at which the pool counts as saturated; keep it below the worker pool's 16 workers
export HF_TOKEN=HF_TOKEN_PLACEHOLDER
export EXTRA_ROUTER_HELM_ARGS= # extra router Helm flags (CI only)
source ${REPO_ROOT}/guides/env.sh
Configuration and Deployment
The guide's Kubernetes manifests are kustomize overlays (modelserver/ and
manifests/), applied into ${NAMESPACE} with kubectl apply -k. Everything runs in that one
namespace, so components address each other by Service name (llm-d-router-epp, redis), and the default
llm-d-async values (values/redis/quota-only.yaml) install as they are.
The alternative llm-d-async values for Scenarios C and D and the GCP paths carry literal placeholders
(POOL_NAME, SAT_CAP and PROM_URL in the saturation overlays, PROJECT_ID on the GCP paths). Render one
for your environment before installing it:
render() {   # render <overlay-path> -> stdout
  sed -e "s/POOL_NAME/${POOL_NAME}/g" \
      -e "s/SAT_CAP/${SAT_CAP:-4}/g" \
      -e "s#PROM_URL#${PROM_URL:-http://llmd-kube-prometheus-stack-prometheus.llm-d-monitoring.svc.cluster.local:9090}#g" \
      -e "s/PROJECT_ID/${PROJECT_ID}/g" "$1"
}
MODEL is not an overlay placeholder — it never appears in a value, only in comments. The served
model name reaches the system through payload.model, which the publish() helper below fills in from
${MODEL}.
1. Install CRDs and Deploy the Backend Model Server
Create the namespace:
kubectl create namespace ${NAMESPACE} --dry-run=client -o yaml | kubectl apply -f -
Install the GAIE InferencePool and llm-d InferenceObjective CRDs (the base guide's prerequisites may already
have installed them; applying them again is harmless):
# GAIE_URL is automatically calculated from GAIE_VERSION at ${REPO_ROOT}/guides/env.sh
kubectl apply -f https://github.com/kubernetes-sigs/gateway-api-inference-extension/${GAIE_URL}/v1-manifests.yaml

# ROUTER_RELEASE_URL is automatically calculated from ROUTER_RELEASE_VERSION at ${REPO_ROOT}/guides/env.sh
kubectl apply -f https://github.com/llm-d/llm-d-router/${ROUTER_RELEASE_URL}/manifests.yaml
Create the llm-d-hf-token secret the model server reads its Hugging Face token
from (HF_TOKEN, set with the environment above). The model server runs in this guide's namespace, so it needs its own copy even if optimized-baseline's
namespace already has one:
kubectl create secret generic llm-d-hf-token \
  --from-literal="HF_TOKEN=${HF_TOKEN}" \
  --namespace "${NAMESPACE}" \
  --dry-run=client -o yaml | kubectl apply -f -
Deploy the vLLM model server:
# only when GPUS=2:
kubectl apply -n ${NAMESPACE} -k ${MT}/modelserver/gpu/vllm/${INFRA_PROVIDER}
# Downloading and loading the model takes several minutes
kubectl -n ${NAMESPACE} rollout status deploy/async-multitenant-optimized-baseline-nvidia-gpu-vllm-decode --timeout=30m
The model server overlay (modelserver/gpu/vllm/) builds on the
optimized-baseline guide's GPU vLLM overlay: the model (Qwen/Qwen3-32B,
two GPUs per replica), image, probes and volumes follow that guide. It labels the pods
llm-d.ai/guide: async-multitenant, which both router values files and the vLLM PodMonitor select on, and runs a
single replica instead of optimized-baseline's two: the router's maxConcurrency and the llm-d-async worker pool
below are sized so that async work saturates one replica.
Single GPU
On one GPU, serve Qwen/Qwen3-8B with tensor parallelism 1 instead (the setup the guide's
eviction measurements used): set GPUS=1 and apply the
single-GPU overlay. The step also sets the served model name to match, because requests carry it in
payload.model:
# only when GPUS=1:
export MODEL=Qwen/Qwen3-8B
kubectl apply -n ${NAMESPACE} -k ${MT}/modelserver/gpu/vllm/single-gpu
# Downloading and loading the model takes several minutes
kubectl -n ${NAMESPACE} rollout status deploy/async-multitenant-optimized-baseline-nvidia-gpu-vllm-decode --timeout=30m
--max-model-len=4000 keeps the KV cache within a 24 GB GPU such as an L4. The overlay's object names match the
default one, so the cleanup below removes either; delete one before applying the other, because the pod
selectors differ.
Prometheus and Grafana: Scenarios C and D and the Observability section read
Prometheus. If you plan to run them, deploy the standard stack now using the central
Observability Setup Guide
(${REPO_ROOT}/guides/recipes/observability/install-prometheus-grafana.sh) and export MONITORING=true
before step 2, so the router is installed with its EPP ServiceMonitor. With the default MONITORING=false
the router installs on a cluster without the Prometheus Operator; you can add the scrape later, as shown in
Observability. On GKE, you can also leverage Google Managed Prometheus (GMP).
2. Configure llm-d-router and Apply InferenceObjectives
Deploy llm-d Router configured with Flow Control and in-flight eviction, and apply the 6 lane InferenceObjectives.
With MONITORING=true, the install also layers the router monitoring values that create the EPP ServiceMonitor:
# only when MONITORING=true:
export MONITORING_VALUES="-f ${REPO_ROOT}/guides/recipes/router/features/monitoring.values.yaml"
# 1. Apply InferenceObjectives for the 6 tier-priority lanes
kubectl apply -n ${NAMESPACE} -k ${MT}/manifests/objectives

# 2. Deploy llm-d-router with Flow Control priority bands and in-flight eviction (or priority holdback)
helm upgrade --install ${POOL_NAME} \
    ${ROUTER_STANDALONE_CHART} \
    -f ${REPO_ROOT}/guides/recipes/router/base.values.yaml \
    ${MONITORING_VALUES} \
    -f ${MT}/values/router/flow-control-${FLOW_CONTROL}.yaml \
    ${EXTRA_ROUTER_HELM_ARGS} \
    -n ${NAMESPACE} --version ${ROUTER_CHART_VERSION}
Priority holdback instead of in-flight eviction
To protect realtime traffic without cancelling async work that is already running, at the cost of idle
headroom while realtime traffic is quiet (see Protecting realtime traffic),
install the router with the holdback values instead: set FLOW_CONTROL and run the step above again.
export FLOW_CONTROL=holdback # router values: values/router/flow-control-holdback.yaml
One InferencePool per router: Deploying llm-d Router creates a single InferencePool named llm-d-router
(POOL_NAME), and the objectives overlay binds all 6 InferenceObjectives to it. With InferenceObjective llm-d.ai/v1, one set of objectives can target multiple InferencePools in the same namespace via poolRefs or poolSelector; with v1alpha2 (poolRef), an objective targets a single pool, so either put each pool and its router in its own namespace or migrate the objectives to llm-d.ai/v1 poolRefs / poolSelector once your cluster serves the v1 CRD.
3. Deploy Redis and llm-d-async
The bundled Redis backs both the per-team request queues and the quota counters.
# only when QUEUE_BACKEND=redis:
kubectl apply -n ${NAMESPACE} -k ${MT}/manifests/redis
kubectl -n ${NAMESPACE} rollout status deploy/redis --timeout=300s

helm upgrade --install llm-d-async \
    oci://ghcr.io/llm-d/charts/llm-d-async \
    -f ${MT}/values/redis/quota-only.yaml \
    -n ${NAMESPACE} --version ${ASYNC_VERSION}
Check the transport:
kubectl -n ${NAMESPACE} get deploy llm-d-async -o yaml | grep transport
# -> --transport=redis-sortedset
Queues are just sorted-set keys — no per-team resource creation needed; they appear on first publish.
GCP Pub/Sub backend
Requires a GCP project with the Pub/Sub API enabled and gcloud authenticated. gcp-setup.sh creates
the per-team topics + subscriptions, the results topic, and the service account + IAM. Set QUEUE_BACKEND=pubsub
and your project in place of the Redis step:
# only when QUEUE_BACKEND=pubsub:
export PROJECT_ID=your-project
${MT}/scripts/gcp-setup.sh                         # topics, subscriptions, results topic, SA + IAM
kubectl apply -n ${NAMESPACE} -k ${MT}/manifests/redis   # still needed for the quota counters
kubectl -n ${NAMESPACE} rollout status deploy/redis --timeout=300s

sed "s/PROJECT_ID/${PROJECT_ID}/g" ${MT}/values/pubsub/quota-only.yaml > /tmp/mt-pubsub.yaml
helm upgrade --install llm-d-async \
    oci://ghcr.io/llm-d/charts/llm-d-async \
    -f /tmp/mt-pubsub.yaml \
    -n ${NAMESPACE} --version ${ASYNC_VERSION}
gcp-setup.sh binds the async-processor service account to pubsub.subscriber, pubsub.publisher,
pubsub.viewer (the readiness probe's GetSubscription) and monitoring.viewer (broker backlog). With
Workload Identity, follow the printed binding to map the GSA onto the chart's llm-d-async KSA.
Configuration Updates & Dynamic Reloading:
-
Hot-Reloadable Redis Queue Transport: When running
llm-d-asyncwith--transport redis-sortedset,--transport-config-file, and--transport-config-watch-interval, changes to thequeuesarray (such as adding, updating, or removing queues and quota parameters) are watched and dynamically reloaded at runtime without dropping in-flight requests or requiring pod restarts. -
Static Helm Configurations: When using inline Helm values without watch intervals, or when altering immutable transport settings (such as Redis URL, worker pool concurrency, merge policy, or on the GCP Pub/Sub backend), configuration is read once at pod startup. Apply changes with:
kubectl rollout restart deploy/llm-d-async -n ${NAMESPACE}
4. (Optional) HTTP front door with the router coordinator
Publishing (below) writes requests straight into Redis. To accept requests over HTTP instead, deploy the
llm-d-router coordinator with its
async-broker step
in front of the router. Each request picks a serving mode with the x-llm-d-async-mode header and a tenant
with x-llm-d-tenant:
x-llm-d-async-mode | Behaviour |
|---|---|
passthrough | Forwarded live to the router, stamped with the tenant's objective (streaming works as usual) |
wait | Written to an llm-d-async queue; the connection is held until the result is back |
enqueue | Written to an llm-d-async queue; answers 202 with an id, and the result is fetched later from GET /v1/requests/{id} |
The coordinator is one more producer of llm-d-async traffic. Its config
(manifests/coordinator/config.yaml) writes queued requests from tenants
premium, standard and batch to the team queues from step 3 (team-premium, team-standard and
team-batch), where they are treated exactly like requests published there directly: same tier, quota gate and
worker pool. Tenant realtime is live traffic only, stamped reserved-interactive (priority 100) and never
counted against a quota. The llm-d-async values from step 3 need no change: the team queues leave the result
destination to each request, so the coordinator gets its results back while requests published straight to
Redis still land on results-list.
The guide's Redis (manifests/redis/redis.yaml) starts with keyspace notifications enabled
(--notify-keyspace-events Kl), so held wait requests wake up as soon as their result lands instead of polling.
kubectl apply -n ${NAMESPACE} -k ${MT}/manifests/coordinator
kubectl -n ${NAMESPACE} rollout status deploy/llm-d-coordinator --timeout=300s
The overlay generates the llm-d-coordinator-config ConfigMap from config.yaml and takes the coordinator image
from the shared coordinator image component, at llm-d-router main: the config uses settings newer than the
v0.11.0 release.
Try it:
kubectl port-forward --address 127.0.0.1 -n ${NAMESPACE} svc/llm-d-coordinator 8080:8080 &
PF_PID=$!
sleep 3
kill -0 ${PF_PID}

# Live, at interactive priority
curl -s 127.0.0.1:8080/v1/completions -H 'Content-Type: application/json' \
  -H 'x-llm-d-async-mode: passthrough' -H 'x-llm-d-tenant: realtime' \
  -d "{\"model\":\"${MODEL}\",\"prompt\":\"hello\",\"max_tokens\":32}"

# Queued on team-batch; the response arrives once llm-d-async has dispatched it
curl -s 127.0.0.1:8080/v1/completions -H 'Content-Type: application/json' \
  -H 'x-llm-d-async-mode: wait' -H 'x-llm-d-tenant: batch' \
  -d "{\"model\":\"${MODEL}\",\"prompt\":\"hello\",\"max_tokens\":32}"

kill ${PF_PID:-} 2>/dev/null || true
A client that disconnects while its wait request is still queued cancels it before dispatch. The coordinator
trusts x-llm-d-tenant as sent, like the rest of the llm-d serving path, so put it behind your own authentication when
tenants matter.
Publishing requests
A request is a JSON body — id, created, deadline, a payload (the inference request that is dispatched to llm-d Router), and metadata.team (the tenant identifier that the quota gate evaluates).
With the optional coordinator from step 4, HTTP clients can submit requests instead; the rest of this section uses Redis directly.
Queues as Serving Dimensions vs. Team Identity
- The Queue is a Serving Dimension: A queue corresponds to a service tier (e.g.,
interactive), not an isolated single-tenant partition although it is used as such in this demo because each team uses a separate queue. - Multiple Teams in One Queue: Requests from different teams can be published into the exact same queue. The team identity is carried per-request inside
metadata.team(e.g.,team: "marketing"vs.team: "engineering"). - Per-Team Quota Accounting: The
redis-quotagate dynamically readsmetadata.teamon each request and increments/decrements that specific team's counter (quota:team:<team>). If Team A saturates its reserved limit, Team A's excess traffic is deprioritized tooverflow, while Team B publishing to that same queue continues to receivereservedcapacity. - Fairness ID: At dispatch,
llm-d-asyncstampsmetadata.teaminto thex-llm-d-inference-fairness-idheader so that llm-d Router's Flow Control fairness policy treats tenants equitably during queue contention.
In this demo walkthrough, queues are labeled with team names (e.g. team-premium) for clear attribution, but you can pass any team name into publish <team> [count]:
publish() {                                   # publish <team> [count]
  local team=$1 n=${2:-1} ttl=${PUBLISH_TTL:-300} now dl run i pairs=()
  now=$(date +%s); dl=$((now+ttl)); run="${now}-${RANDOM}"
  # The whole batch goes in one exec — ZADD takes any number of score/member pairs. One exec
  # per request trickled `publish batch 100` in over minutes, and the workers drained it as
  # fast as it arrived: no backlog to classify as overflow. The batch shares a score, so
  # ZPopMin breaks ties on the member string — the zero-padded index makes that publish order.
  for i in $(seq 1 "$n"); do
    pairs+=("$dl" "$(printf '{"internal":{},"request_kind":"plain","data":{"id":"%s-%s-%04d","created":%s,"deadline":%s,"payload":{"model":"%s","prompt":"summarize this","max_tokens":64},"metadata":{"team":"%s"}}}' \
      "$team" "$run" "$i" "$now" "$dl" "$MODEL" "$team")")
  done
  kubectl -n ${NAMESPACE} exec -i deploy/redis -- redis-cli ZADD "team-${team}" "${pairs[@]}"
}
# e.g.  publish premium 5     # premium team; prints the number enqueued.
#   PUBLISH_TTL=900 publish batch 400   # one deadline covers the batch — raise it if a
#                                       # saturated pool will not drain within 300s.
# Keep the count in the low thousands: every pair travels in the one exec's argv.
Publishing to GCP Pub/Sub
publish() {                                   # publish <team> [count]
  local team=$1 n=${2:-1} ttl=${PUBLISH_TTL:-300} par=${PUBLISH_PAR:-8} now dl run i
  now=$(date +%s); dl=$((now+ttl)); run="${now}-${RANDOM}"
  # gcloud publishes one message per invocation, so keep `par` of them in flight: serially,
  # `publish batch 100` takes minutes and never builds the backlog the scenarios need.
  # Each invocation is a fresh Python process — lower PUBLISH_PAR if memory is tight.
  for i in $(seq 1 "$n"); do
    gcloud pubsub topics publish "team-${team}-requests" --project "$PROJECT_ID" \
      --attribute "team=${team}" \
      --message "$(printf '{"id":"%s-%s-%04d","created":%s,"deadline":%s,"payload":{"model":"%s","prompt":"summarize this","max_tokens":64},"metadata":{"team":"%s"}}' \
        "$team" "$run" "$i" "$now" "$dl" "$MODEL" "$team")" >/dev/null &
    (( i % par )) || wait
  done
  wait
}
Stress Testing Scripts
Two end-to-end stress testing scripts are provided in scripts/ to drive sustained multi-tenant traffic (team × tier) concurrently to test quota, priority lanes, and populate dashboard metrics:
-
GCP Pub/Sub:
scripts/stress-test-pubsub.pyPROJECT_ID=${PROJECT_ID} ${MT}/scripts/stress-test-pubsub.py -
Redis SortedSet:
scripts/stress-test-redis.pyNAMESPACE=${NAMESPACE} ${MT}/scripts/stress-test-redis.py
scripts/benchmark-heavy-redis.py enqueues 600 requests across the three team
queues and reports how they drain. It reads in-flight and queue-depth gauges from Prometheus at BENCH_PROM_URL
(default http://localhost:9090, port-forwarded to the central Prometheus automatically), not the in-cluster
PROM_URL the gates use:
NAMESPACE=${NAMESPACE} ${MT}/scripts/benchmark-heavy-redis.py
Scenarios A & B — reserved vs. overflow
A. Steady state — each team within its reserved quota:
for t in premium standard batch; do publish "$t" 1 & done; wait
Every request is within its team's quota, so all are reserved and dispatched in tier order
(premium→standard→batch), stamped with their respective lane objectives (reserved-interactive, reserved-async, reserved-batch). Read results from the results list:
kubectl -n ${NAMESPACE} exec deploy/redis -- redis-cli LRANGE results-list 0 -1
Each result is JSON with
id,payload(the upstream response body), andstatus_code(the upstream HTTP status). Non-HTTP failures carrystatus_code: 0pluserror_code/error_message(e.g.GATE_DROPPED,DEADLINE_EXCEEDED).
B. Overflow deprioritization — flood batch past its reserved quota (1) while premium runs within
quota:
publish batch   100 &   # far exceeds batch's reserved 1 -> excess is overflow (lane 5)
publish premium 20  &   # premium reserved (lane 0) -> always jumps ahead
wait
-
Priority: batch's first concurrent request stays
reserved(lane 2); the rest areoverflow(lane 5), dispatched only after all reserved and higher-tier overflow. The per-team counter caps at the reserved limit; the excess flows as overflow (not nacked):kubectl -n ${NAMESPACE} exec deploy/redis -- redis-cli GET quota:team:batch # <= 1kubectl -n ${NAMESPACE} exec deploy/redis -- redis-cli GET quota:team:premium # independent counter -
Team isolation: premium has its own counter, so batch's overload does not use up premium's reserved quota — premium's 20 requests finish ahead of batch's overflow.
Scenario C — priority under saturation
Switch to the saturation overlay (adds the worker pool's wait-on-refuse(prometheus-query) gate) after
bringing up self-hosted Prometheus, then drive sustained load:
render ${MT}/values/redis/saturation-prometheus.yaml > /tmp/mt-redis-sat.yaml
grep prometheusURL /tmp/mt-redis-sat.yaml    # must be your Prometheus, not the literal PROM_URL
helm upgrade llm-d-async \
    oci://ghcr.io/llm-d/charts/llm-d-async \
    -f /tmp/mt-redis-sat.yaml -n ${NAMESPACE} --version ${ASYNC_VERSION}
Confirm the gates can reach Prometheus before you read anything into the result. The gates are
wait-on-refuse(prometheus-query) with "fallback":"1" — a budget of 1 is a wide-open gate, so an
unreachable Prometheus produces a run that looks perfect and demonstrates nothing.
# 1. The URL the gates use resolves and answers, from inside the cluster:
kubectl run --rm -i promcheck --image=curlimages/curl --restart=Never -n ${NAMESPACE} -- \
    curl -sS --max-time 5 "${PROM_URL}/api/v1/query?query=up" | head -c 120
# -> {"status":"success",...}   anything else means the gates are blind

# 2. vLLM is actually being scraped (the metric the gates read):
kubectl run --rm -i promcheck-vllm --image=curlimages/curl --restart=Never -n ${NAMESPACE} -- \
    curl -sS --max-time 5 --data-urlencode "query=sum(vllm:num_requests_running{inference_pool=\"${POOL_NAME}\"})" \
    "${PROM_URL}/api/v1/query" | head -c 200
# -> a result with a value; an empty "result":[] means the PodMonitor is not matching

# 3. The processor is not silently falling back:
kubectl logs -n ${NAMESPACE} deploy/llm-d-async --tail=200 | grep -i "using fallback value" \
    && echo ">>> gates are on the fallback budget (1 = wide open), not on live metrics"
Then drive sustained load:
publish premium 200 & publish batch 200 &
wait
As the InferencePool saturates, the budget → 0 and the teams workers park in-memory (ActionWait) —
the pool stops pulling new work without churning the backlog. As capacity frees, the merge policy drains the
highest lanes first. With several InferencePools, each worker pool's gate reads its own pool, so only the
workers feeding the saturated pool park. Query the budget:
# Assumes the central Prometheus install from Observability below; point this at
# whatever ${PROM_URL} resolves to if your Prometheus lives elsewhere.
kubectl port-forward -n llm-d-monitoring svc/llmd-kube-prometheus-stack-prometheus 9090:9090 &
curl -s localhost:9090/api/v1/query --data-urlencode \
  "query=clamp(1 - sum(vllm:num_requests_running{inference_pool=\"${POOL_NAME}\"})/${SAT_CAP}, 0, 1)"  # budget -> 0

# Parked workers hold their message instead of dispatching, so the pool's in-flight count
# hovers near ${SAT_CAP} instead of climbing to its 16 workers:
curl -s localhost:9090/api/v1/query --data-urlencode \
  "query=sum by (pool_name) (llm_d_async_async_inflight_requests)"
What "saturated" should look like: under this load the budget reaches exactly 0 and stays there in
stretches. If it never reaches 0, the scenario is
not actually happening — nothing parks, and the run still completes and looks healthy. Check SAT_CAP
against the sizing rule below before concluding the gate worked.
SAT_CAP must be smaller than the pool's workers. prometheus-query closes its gate at
budget <= 0, and clamp(..., 0, 1) floors the budget at 0 — so the gate closes only once
SAT_CAP requests are running on that model. Scenario C's load is entirely async, so the only
thing driving that count is the pool's own workers (16 in the overlays), and a worker
evaluates the gate while holding a message it has not dispatched yet: at most workers - 1 of the
pool's requests are running at that moment. Set SAT_CAP at or above workers and the budget can
never reach 0. The default SAT_CAP=4 leaves margin on two counts: vllm:num_requests_running
counts only requests the model server is actively running, not ones waiting in its queue, and the
gate reads it through a 15s PodMonitor scrape plus prometheusCacheTTL: 5s, so the count it acts
on is up to ~20s behind the pool.
In production the divisor is a capacity number, not a demo knob: size it to the pool's real
concurrent-request capacity (ready pods × per-pod concurrency) and give the pool enough workers
to reach it. The gate is back-pressure against all traffic on the pool — including synchronous
traffic that does not go through llm-d-async — so there the count is not bounded by this processor's workers.
Scenario D — tier-priority-admission with prometheus-saturation
An advanced alternative to wait-on-refuse(prometheus-query) is the tier-priority-admission worker pool gate,
paired with prometheus-saturation as its inner saturation detector.
While wait-on-refuse applies a uniform park action to all requests when the pool is saturated, tier-priority-admission
issues a three-way verdict based on saturation × tier × classification:
| Pool Status | Request Classification & Tier | Gate Verdict | Behavior |
|---|---|---|---|
| Unsaturated | Any | ActionContinue | Dispatches immediately to llm-d router |
| Saturated | reserved (any tier) | ActionWait | Parks the worker in-memory until capacity frees |
| Saturated | overflow + interactive | ActionDrop | Drops immediately with an HTTP 429 payload |
| Saturated | overflow + async / batch | ActionRefuse | Refuses message and re-enqueues for later delivery |
The configurations are provided in:
- Redis SortedSet:
values/redis/tier-priority-admission.yaml - GCP Pub/Sub:
values/pubsub/tier-priority-admission.yaml
To deploy on Redis:
render ${MT}/values/redis/tier-priority-admission.yaml > /tmp/mt-tier-priority-admission.yaml
helm upgrade llm-d-async \
    oci://ghcr.io/llm-d/charts/llm-d-async \
    -f /tmp/mt-tier-priority-admission.yaml -n ${NAMESPACE} --version ${ASYNC_VERSION}
# Worker pools ship in a ConfigMap the processor reads at startup; this upgrade changes only the
# pools, so restart the processor to pick up the new gate.
kubectl rollout restart deploy/llm-d-async -n ${NAMESPACE}
kubectl rollout status deploy/llm-d-async -n ${NAMESPACE}
GCP Pub/Sub deployment
render ${MT}/values/pubsub/tier-priority-admission.yaml > /tmp/mt-pubsub-tier-priority.yaml

helm upgrade llm-d-async \
    oci://ghcr.io/llm-d/charts/llm-d-async \
    -f /tmp/mt-pubsub-tier-priority.yaml -n ${NAMESPACE} --version ${ASYNC_VERSION}
kubectl rollout restart deploy/llm-d-async -n ${NAMESPACE}   # pick up the new worker pool gate
kubectl rollout status deploy/llm-d-async -n ${NAMESPACE}
The inner prometheus-saturation gate queries the Prometheus server (${PROM_URL}) for the metric llm_d_epp_flow_control_pool_saturation exported by llm-d Router's EPP /metrics endpoint.
Router Metrics Scraping: the EPP's ServiceMonitor/llm-d-router-epp-monitor exists only if the router was installed with MONITORING=true (step 2). Prometheus must be scraping llm_d_epp_flow_control_pool_saturation; otherwise the gate receives empty data and silently falls back to fallback: 1.0 (budget 1.0, wide open), and never closes under saturation. If you installed the router with the default MONITORING=false, add the scrape with the router upgrade in Observability before running this scenario.
Verify that the metric is being scraped and that the gate evaluates metrics live:
# 1. Verify Prometheus has scraped the saturation metric from llm-d-router:
curl -s localhost:9090/api/v1/query --data-urlencode \
    "query=llm_d_epp_flow_control_pool_saturation{inference_pool=\"${POOL_NAME}\"}"

# 2. Verify the gate initialized with the inner prometheus-saturation source. Empty output means
#    the processor is still running the previous gate: restart it as above.
kubectl logs -n ${NAMESPACE} deploy/llm-d-async | grep -i "tier-priority-admission"

# 3. Check gate evaluation and verify source availability (must report 1, not 0):
ASYNC_POD_IP=$(kubectl get pod -l app.kubernetes.io/name=llm-d-async -n ${NAMESPACE} -o jsonpath='{.items[0].status.podIP}')
kubectl run curl-prom --rm -i --restart=Never -n ${NAMESPACE} --image=curlimages/curl -- \
    curl -s "http://${ASYNC_POD_IP}:9090/metrics" | grep "async_gate_metric_source_available"
async_gate_metric_source_available must be 1. If it reports 0, the gate failed to query Prometheus or received no metric samples, causing it to fall back to an open budget (fallback: 1.0). A value of 1 confirms that the gate is receiving real live measurements from Prometheus.
Observability
Self-hosted Prometheus + Grafana works on any cluster and the gates query it in real time; it is the path for the Redis backend. You can leverage the centralized Observability Setup Guide to install the standard Prometheus and Grafana stack:
# 1. Install standard Prometheus + Grafana stack
${REPO_ROOT}/guides/recipes/observability/install-prometheus-grafana.sh

# 2. Scrape the vLLM model server
kubectl apply -n ${NAMESPACE} -k ${MT}/manifests/monitoring

# 3. Scrape the llm-d Router EPP. Skip this if step 2 ran with MONITORING=true; otherwise
#    re-run the router install with the monitoring values layered in, which adds the
#    ServiceMonitor without touching the flow-control configuration:
export MONITORING=true
export MONITORING_VALUES="-f ${REPO_ROOT}/guides/recipes/router/features/monitoring.values.yaml"
helm upgrade --install ${POOL_NAME} \
    ${ROUTER_STANDALONE_CHART} \
    -f ${REPO_ROOT}/guides/recipes/router/base.values.yaml \
    ${MONITORING_VALUES} \
    -f ${MT}/values/router/flow-control-${FLOW_CONTROL}.yaml \
    ${EXTRA_ROUTER_HELM_ARGS} \
    -n ${NAMESPACE} --version ${ROUTER_CHART_VERSION}
Open Grafana (admin/admin in the demo values) and run the Scenario-C load; the Async Processor
dashboard shows async_dispatch_budget, async_inflight_requests, async_gate_decisions_total, and
async_broker_backlog{queue_name,pool_name}. Break panels down by pool_name (teams) for the per-pool view and by queue_name for the per-team
view.
async_dispatch_budget is the queue gates' budget (the per-team quota gates), so it says nothing
about the per-pool saturation gates. Those report through async_gate_metric_value — the value the
gate last read, i.e. the clamp(...) result — against async_gate_metric_threshold, which the gate
closes at (value <= threshold, and prometheus-query pins the threshold to 0). Both are labelled
by the owning pool_name:
llm_d_async_async_gate_metric_value{pool_name="teams"}       # -> 0 while the pool is parked
llm_d_async_async_gate_metric_threshold{pool_name="teams"}   # -> 0
Their absence is itself a signal: the gauges are only written on a successful read, so a missing
or frozen async_gate_metric_value means the gate is running on its fallback budget. Cross-check
against Prometheus directly as in Scenario C.
GCP Cloud Monitoring (GKE)
kubectl apply -n ${NAMESPACE} -f ${MT}/manifests/gmp-podmonitoring.yaml    # AP metrics -> Cloud Monitoring

# Deploy Cloud Monitoring dashboard (supports both Redis and Pub/Sub backends):
gcloud monitoring dashboards create --project ${PROJECT_ID} \
  --config-from-file=${MT}/dashboards/cloud-monitoring.json

# For the gates' in-cluster PromQL reads on Pub/Sub (option A), deploy the GMP query frontend and
# upgrade to the GMP saturation overlay:
render ${MT}/manifests/gmp-frontend.yaml | kubectl apply -n ${NAMESPACE} -f -
render ${MT}/values/pubsub/saturation-gmp.yaml > /tmp/mt-pubsub-sat.yaml
helm upgrade llm-d-async oci://ghcr.io/llm-d/charts/llm-d-async \
  -f /tmp/mt-pubsub-sat.yaml -n ${NAMESPACE} --version ${ASYNC_VERSION}
The PodMonitoring ingests the AP metrics; the dashboards chart request/success rate, in-flight, p95
latency, broker backlog (llm_d_async_async_broker_backlog), in-process queue depth (llm_d_async_async_queue_depth),
exceeded deadlines, deadline proximity (llm_d_async_async_deadline_proximity_millis), and token throughput.
Note that deadline proximity only works when Redis Sorted Set queues are used (--transport=redis-sortedset).
The gate-metric panels need an image newer than v0.7.2. GMP / Monarch lags real time ~1–2 min, so gate control
is bang-bang on that timescale; the self-hosted Prometheus path reacts within one scrape.
Nightly test
Two GKE nightlies deploy this guide from its guide.yaml, including the optional coordinator
from step 4, through scripts/nightly-deploy-gke.sh (scripts/guide.py emit),
one for each router values file:
nightly-e2e-async-multitenant-gke-acc-gpu-vllm-x(21:00 UTC): the default, in-flight eviction. Its TTFT allowance at 100 % realtime load is wider (AMT_LEVEL_100_TTFT_ABS=0.6): with the pool full of realtime work, a realtime request that finds an async request in its slot waits for an eviction, which adds up to about half a second to the slowest requests.nightly-e2e-async-multitenant-holdback-gke-acc-gpu-vllm-x(20:00 UTC): priority holdback (FLOW_CONTROL=holdback).
Each benchmarks realtime traffic (the coordinator's passthrough mode) with and without a queued llm-d-async
backlog (wait mode) at 20/80/90/100 % of the router's configured capacity. What the nightlies measure and how
their bounds are chosen is documented with the validator in
.github/scripts/e2e/async-multitenant/.
Both lanes rely on the router protecting realtime traffic (see Protecting realtime traffic): without holdback or eviction, async work admitted up to and past the router's capacity makes realtime requests wait behind it and the isolation checks fail (measurements in llm-d-async#468).
Status
Tier 3 (Validated), per the guide policy.
Reference environment: GKE, two NVIDIA H100s, vLLM, Qwen/Qwen3-32B.
Gaps to Tier 4: no reviewed benchmark results for the guide yet.
Notes & gotchas
- Image / version. The overlays no longer pin an image tag — the image tracks the chart's
appVersion, selected by--version ${ASYNC_VERSION}. Use a release whose chart is published toghcr.io/llm-d/charts(v0.8.0+). - Reserved quota vs. pool size. Each team's quota is its reserved capacity (priority
lane) in
classifyingmode, not a hard cap — over-quota flows asoverflow. Keep the sum of the reserved quotas at or below the worker pool's worker count. - Quota counters are keyed
quota:team:<team>. When onellm-d-asyncfeeds severalInferencePools, give each pool's queues a distinct quotaprefixso a team's reserved capacity on one pool is independent of its capacity on another. - Saturation gate. The Scenario C overlays use
prometheus-queryovervllm:num_requests_running. Theprometheus-saturationgate (Scenario D) instead expects the EPP metricllm_d_epp_flow_control_pool_saturation. - Saturation divisor vs. pool size.
SAT_CAPis the concurrency at which the pool counts as saturated, and the gate closes only when the budget hits 0 — i.e. only onceSAT_CAPrequests are running. Keep it below that pool'sworkers, or async load alone can never close the gate; see Scenario C. - An unreachable Prometheus fails open, not closed. The saturation gates set
"fallback":"1", and a budget of 1 is a fully open gate. IfPROM_URLis wrong, or the vLLMPodMonitormatches nothing, Scenario C completes cleanly and demonstrates nothing — no error, no parked pool. Run the three checks in Scenario C before drawing conclusions from a run. - Deadline Proximity.
llm_d_async_async_deadline_proximity_millisis only supported when using Redis Sorted Set queues (--transport=redis-sortedset). Cloud Pub/Sub cannot expose per-item deadlines, so this metric is only emitted on Redis.
Cleanup
# --ignore-not-found: the coordinator (step 4) and the PodMonitor (Observability) are optional
kubectl delete -n ${NAMESPACE} -k ${MT}/manifests/coordinator --ignore-not-found
helm uninstall llm-d-async -n ${NAMESPACE}
helm uninstall ${POOL_NAME} -n ${NAMESPACE}
kubectl delete -n ${NAMESPACE} -k ${MT}/manifests/objectives
# Either model server overlay: the single-GPU one has the same object names
kubectl delete -n ${NAMESPACE} -k ${MT}/modelserver/gpu/vllm/${INFRA_PROVIDER}
kubectl delete -n ${NAMESPACE} -k ${MT}/manifests/redis
kubectl delete -n ${NAMESPACE} -k ${MT}/manifests/monitoring --ignore-not-found
GCP Pub/Sub cleanup
# only when QUEUE_BACKEND=pubsub:
kubectl delete -n ${NAMESPACE} -f ${MT}/manifests/gmp-frontend.yaml -f ${MT}/manifests/gmp-podmonitoring.yaml
gcloud monitoring dashboards list --project ${PROJECT_ID} --filter='displayName:"Async Processor"' \
  --format='value(name)' | xargs -r -n1 gcloud monitoring dashboards delete --project ${PROJECT_ID} --quiet
PROJECT_ID=${PROJECT_ID} DELETE_SA=1 ${MT}/scripts/gcp-teardown.sh