SLO-Aware Autoscaling with KEDA and Predicted Latency
Autoscale a vLLM inference pool against latency SLOs — for example, "keep P90 time-to-first-token under 3 s and P90 time-per-output-token under 100 ms, with as few GPUs as possible" — using only off-the-shelf components:
- llm-d-router (EPP) emits per-request latency histograms — the pool's estimated P90 TTFT/TPOT, sourced either from the EPP's online-trained ML latency predictor (predicted latency) or, when that's not enabled, aggregated from the actual measured latencies in real time,
- Prometheus recording rules turn those into a single saturation signal,
- KEDA (with an expr-lang formula) computes the desired replica count and drives a standard HPA.
No custom controller, no CRDs beyond KEDA's ScaledObject. The control law — the rule that maps the current saturation signal to a desired replica count — is ~5 lines of math. The predicted signal reacts a little earlier, but either source drives the same loop — the guide uses "predicted" throughout because it's what we benchmarked, but read it as estimated latency wherever it matters.
Scope: one variant, one SLO pair. The recording rules bake in a single TTFT/TPOT SLO target and aggregate the EPP's latency histograms pool-wide, so this guide assumes one inference pool serving one model variant against one SLO pair. It does not yet handle multiple variants of the same model (e.g. the same model on two accelerator types, or split across separate inference pools) or multiple SLO tiers — those would need per-variant recording rules and a way to identify the variant at the EPP level. For a disaggregated (prefill/decode) deployment, TTFT would drive the prefill pool and TPOT the decode pool; adapting the signal chain for that is future work.
Prerequisites
-
A running llm-d serving stack. Follow the optimized-baseline guide (vLLM inference pool + EPP). Then, to feed this autoscaler the predicted-latency signal, add the
predicted-latency-producerplugin to the EPP'sEndpointPickerConfig(the exact config we benchmarked is inslo-aware/epp-plugins-configmap.yaml):plugins:- type: predicted-latency-producerparameters:streamingMode: trueThis plugin is optional: the recording rules below fall back to the EPP's actual-latency histograms when the predicted series are absent — predicted latency just reacts earlier (it rises as pressure builds instead of after queueing has already happened).
-
The EPP's metrics scraped by Prometheus — this is the whole input to the loop; without it the signal is empty and the pool sits at minReplicas. The router chart's
monitoringfeature wires this up — deploy the router with that values file, e.g.:# monitoring.values.yaml exposes port 9090 + ServiceMonitorhelm upgrade <release> $ROUTER_STANDALONE_CHART \-f ../../recipes/router/base.values.yaml \-f ../../predicted-latency-routing/router/predicted-latency.values.yaml \-f ../../recipes/router/features/monitoring.values.yaml \... -n <ns> --version $ROUTER_CHART_VERSIONIt exposes the EPP's metrics port (9090) and creates a ServiceMonitor so Prometheus discovers it. Verify with
kubectl get servicemonitor -n <ns>and, in Prometheus,up{job=~".*epp.*"} == 1. Scrape interval ≤ 15 s (we use 5 s) to match the 1 m rate windows below. -
kube-state-metrics. The control law reads the target Deployment's provisioned and ready replica counts, which kube-state-metrics exposes to Prometheus. Any standard install works; if you don't already run it, a minimal deployments-only install is in
slo-aware/kube-state-metrics.yaml. -
KEDA ≥ 2.15 (we ran 2.20.1):
kubectl apply --server-side -f https://github.com/kedacore/keda/releases/download/v2.20.1/keda-2.20.1.yaml.
How it works
The recording rules reduce the EPP's latency histograms to a single
saturation signal s — the pool's P90 TTFT/TPOT as a fraction of your SLO
targets (worst of the two; clamped and smoothed against spikes). The KEDA
formula turns s into a desired replica count: scale up when s crosses
the upper threshold, scale down when it falls below the lower one, and hold
steady in the dead band between them so the pool doesn't flap. While new
pods are still warming, an in-flight credit discounts the ask so one load
step doesn't over-scale to the cap, and the HPA behavior block shapes the
response: burst up fast, drain down slowly. More ready replicas lower per-pod
load, s falls back into the band, and the loop settles.
The full control law — the signal chain, the piecewise formula, and why each asymmetry exists — is derived in SLO-Aware Autoscaling with KEDA — the control law.
Deploy
Set the guide environment variables:
export BRANCH=main
export REPO_ROOT=$(realpath $(git rev-parse --show-toplevel))
export NAMESPACE=llm-d-optimized-baseline
export KEDA_VERSION=2.20.1
export SLO_DIR=${REPO_ROOT}/guides/workload-autoscaling/slo-aware
Source the common guide environment variables:
source ${REPO_ROOT}/guides/env.sh
Install KEDA (see the Revert section below for the APIService caveat if prometheus-adapter is already installed):
kubectl apply --server-side -f https://github.com/kedacore/keda/releases/download/v${KEDA_VERSION}/keda-${KEDA_VERSION}.yaml
The manifests ship with our example names — adjust them to your cluster before applying:
- in
slo-aware/scaledobject.yaml: the target Deployment (optimized-baseline-nvidia-gpu-vllm-decode), its namespace (llm-d-optimized-baseline), and the Prometheus address (prometheus-server.monitoring.svc:80) — in thescaleTargetRefand the three trigger queries; - in
slo-aware/prometheus-rule.yaml: the SLO targets (3 s TTFT / 100 ms TPOT) if yours differ, thenamespace(it ships in the workload namespacellm-d-optimized-baseline, notmonitoring— the rules belong to the tenant they scale), and thelabelsso your Prometheus'sruleSelectorpicks it up.
kubectl apply -f ${SLO_DIR}/kube-state-metrics.yaml
kubectl apply -f ${SLO_DIR}/prometheus-rule.yaml
kubectl apply -f ${SLO_DIR}/scaledobject.yaml
Verify the ScaledObject is created and KEDA's HPA exists:
kubectl get scaledobject -n ${NAMESPACE}
kubectl get hpa -n ${NAMESPACE}
The recording rules ship as a Prometheus Operator PrometheusRule in the
workload namespace. For the operator to load it, its namespace must match your
Prometheus's ruleNamespaceSelector and its labels your ruleSelector (see the
file's comment for how to inspect both). The recorded series are global in
Prometheus either way — the namespace choice is about ownership, not metric
isolation (one rule-set per Prometheus for now — see the Scope note above).
On a plain (non-operator) Prometheus, merge its spec.groups into your
rule_files config and reload instead.
The moment the ScaledObject is created, KEDA's HPA owns the Deployment's
replica count: an idle pool drains to minReplicaCount.
Recommended — fast pod warmup. Pod-ready time is about half the scale-up transient, so shortening it is the highest-leverage tuning after the control law itself. Apply the warmup patch to your decode Deployment (cuts pod-ready from ~2 m 15 s to ~100 s):
kubectl -n <serving-namespace> patch deploy <decode-deployment> \
  --type=strategic --patch-file slo-aware/decode-warmup-patch.yaml
Tunables
Start from the benchmarked values and adjust by symptom:
| Symptom | Knob (where) | Benchmarked value | Direction |
|---|---|---|---|
| Wrong latency targets for your workload | SLO targets (recording rules) | 3000 ms / 100 ms | Set to your SLOs — the signal is latency ÷ SLO, so everything else scales with these |
| SLO is on a different tail (e.g. median vs P99) than the signal | latency quantile (recording rules) | P90 (histogram_quantile(0.9, …)) | Match the quantile in your SLO; higher = more sensitive to outliers |
| Pool stays scaled up long after a brief spike passes | clamp (recording rules) | 2.0 | Lower it (must stay above θ_up) so one spike can't inflate the moving average |
| Replica count jitters on noisy samples / reacts too slowly to real load steps | smoothing window (recording rules) | 45 s | Lengthen to calm jitter; shorten to react faster |
| Scale-up fires only after the SLO is already breached | scale-up threshold (formula) | 0.55 | Lower it to fire earlier on the pre-knee rise |
| Pool over-provisions under healthy load (SLO close to base latency) | band (formula) | 0.55 / 0.40 | Raise both — healthy saturation sits higher when there's little headroom |
| Pool flaps between scale-up and scale-down | gap (formula) | 0.15 | Widen the dead band |
| Floor too low for your traffic base / cap hit at peak | min/max replicas (ScaledObject) | 3 / 8 | Raise to fit your traffic floor and budget ceiling |
| Big load steps outrun the scale-up / drain sheds so fast it re-triggers | HPA behavior (ScaledObject) | up max(100 %, 4)/60 s; down 1/120 s | Raise the up burst; slow the down rate |
| SLO violations concentrated during pod warmup | pod-ready time (Deployment) | ~100 s with decode-warmup-patch.yaml | Shorten warmup — highest-leverage fix; see Deploy above |
What it looks like
On H100 (Qwen3-32B, TP=2), staged ramp 2→10→1 rps, bounds 3–8, the loop averages 95.8 % combined SLO attainment at 5.93 average replicas across repeated runs (a static pool sized for peak is 100 % at 8). One episode is plotted below; the annotations trace each governing parameter to the behavior it produces — trigger, burst, warmup, drain.
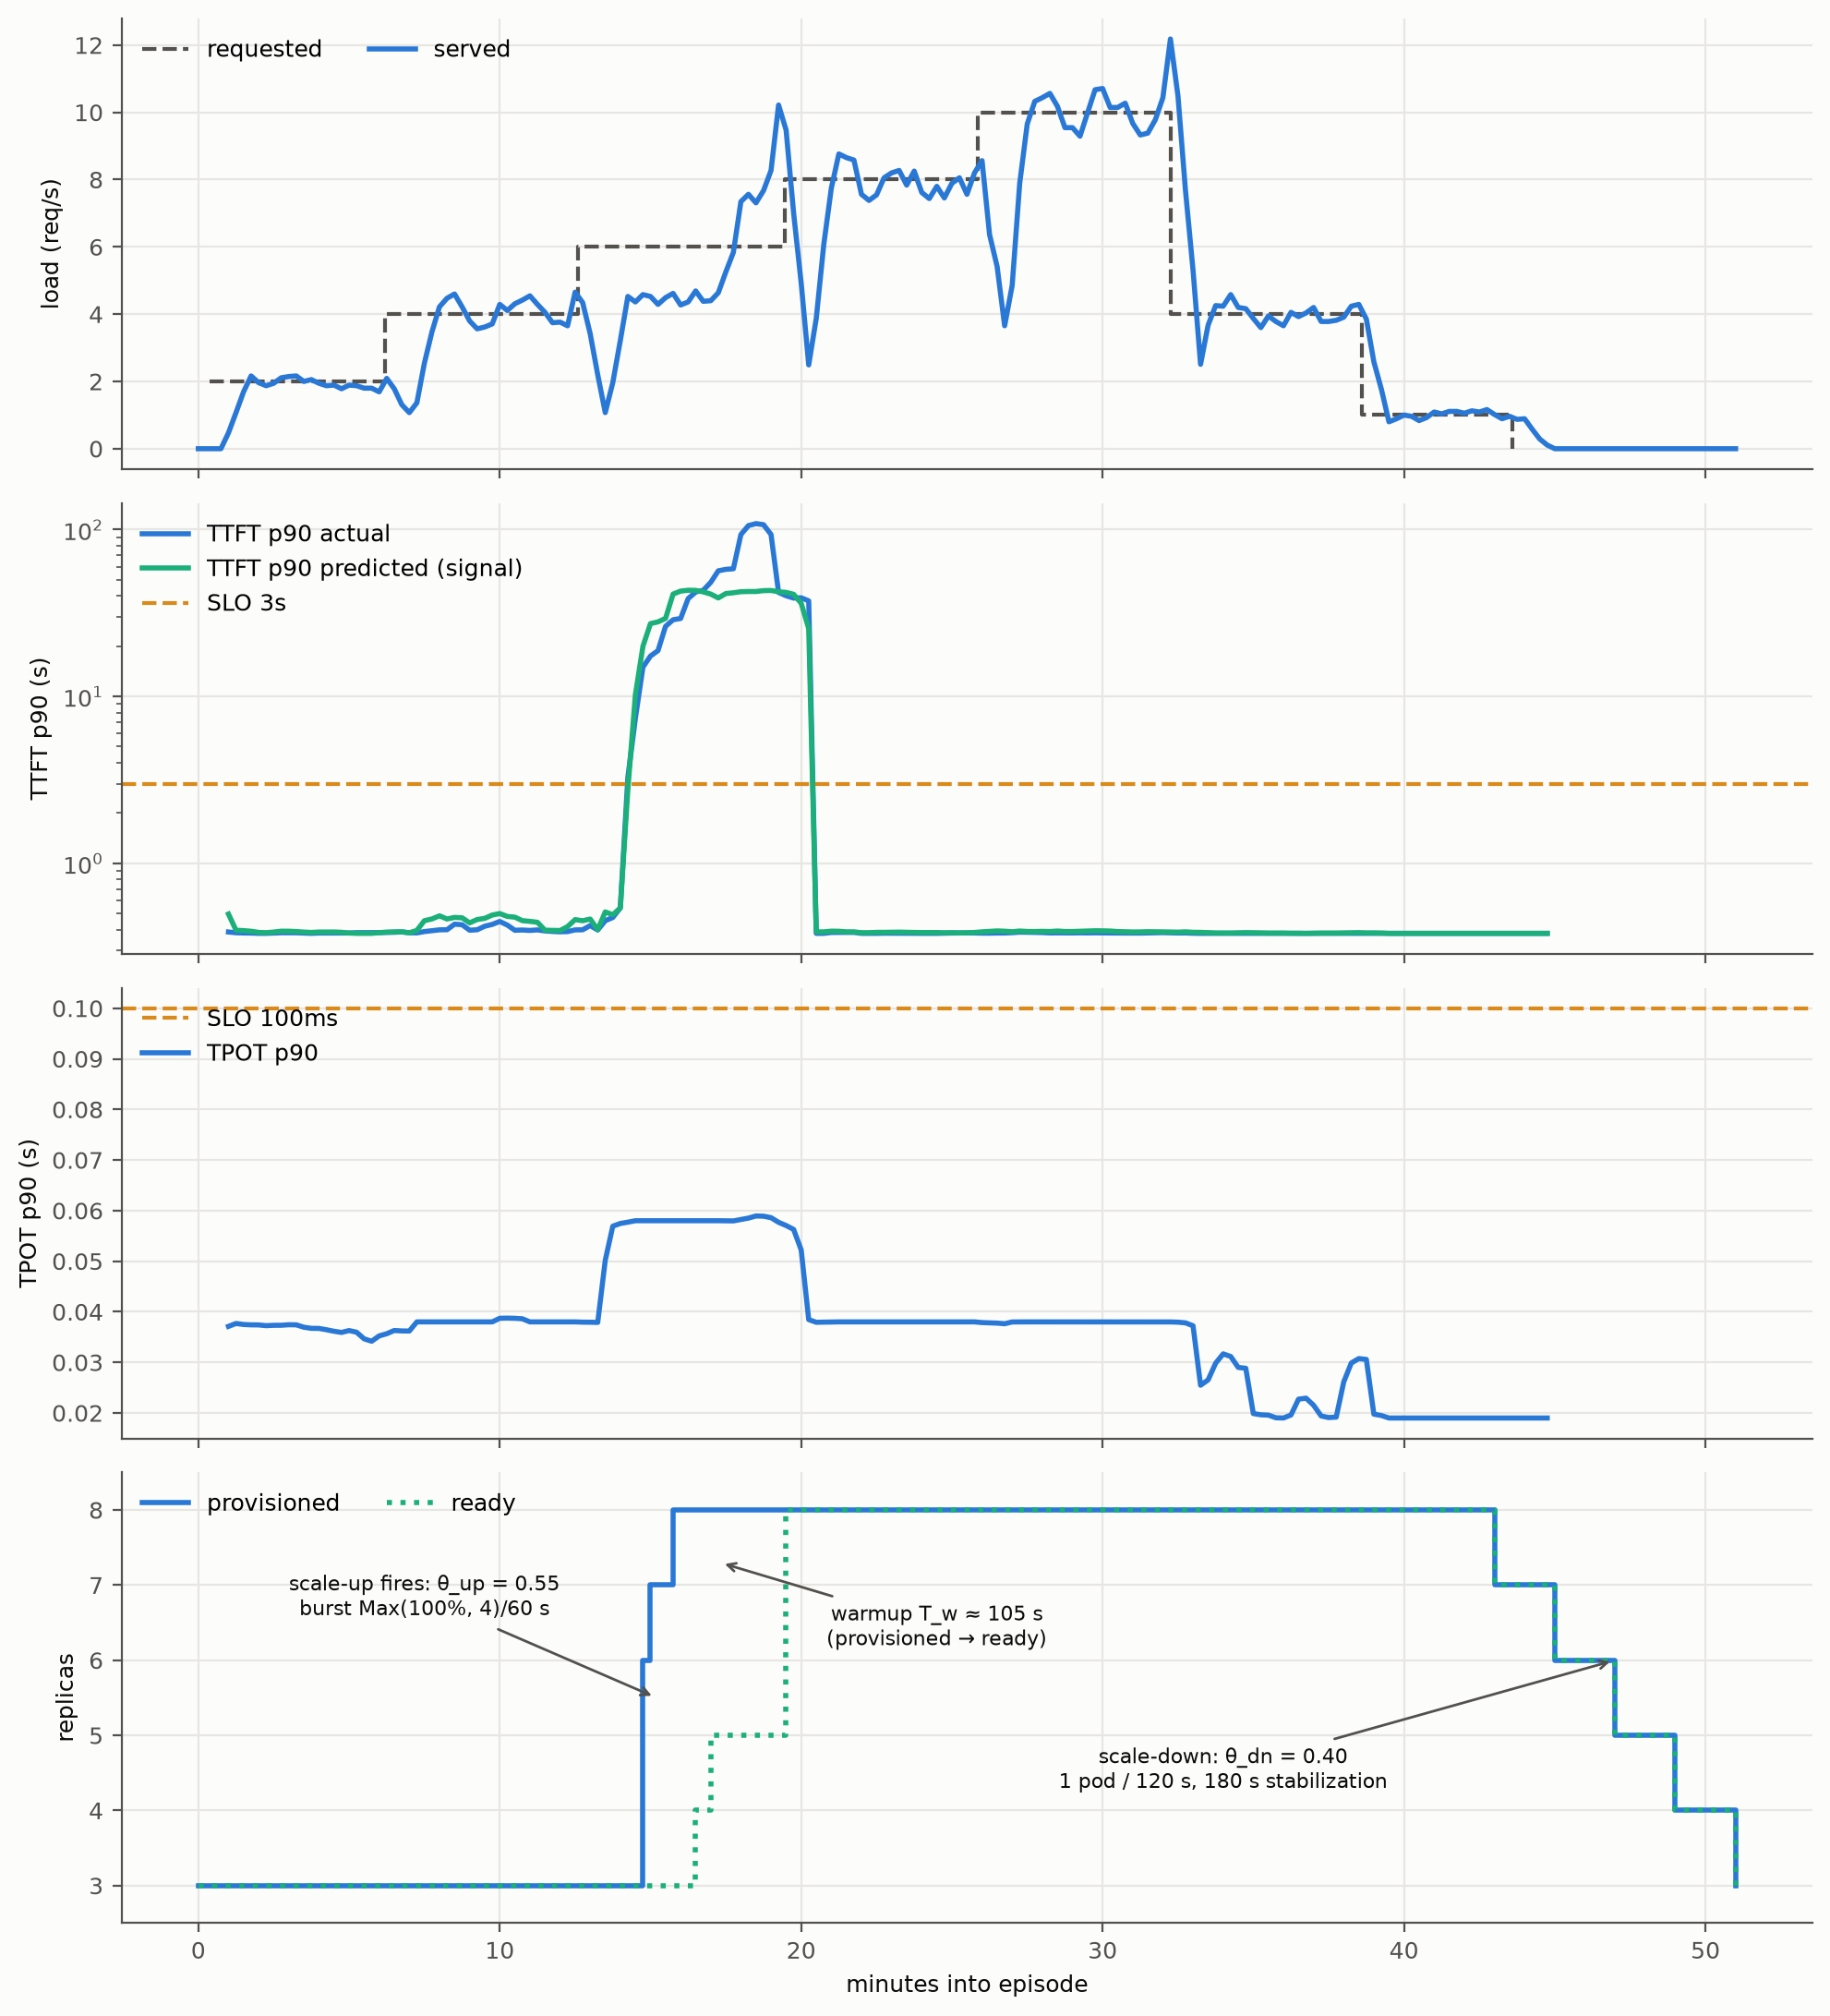
The pool holds at the floor while healthy, bursts to the cap when the signal
crosses θ_up, then drains a pod at a time once load falls. When residual
violations appear they cluster at the first capacity crossing, where a load step
lands on an under-provisioned pool before the new pods finish warming — the
structural cost of any reactive-signal + slow-actuation loop; the episode
plotted caught one such crossing. Full methodology and breakdown:
benchmark-templates/BENCHMARK.md.
Files
| File | What |
|---|---|
slo-aware/ | the autoscaler: kube-state-metrics, recording rules (the saturation signal), ScaledObject (control law + HPA behavior), and the recommended decode-warmup-patch.yaml. KEDA itself installs from its upstream release (see Prerequisites). |
slo-aware/epp-plugins-configmap.yaml | the EPP plugin config we ran, incl. predicted-latency-producer |
slo-aware/benchmark-templates/ | reusable benchmark harness: methodology (BENCHMARK.md), llm-d-benchmark workload profiles for the burn-in and scored episodes, and the plot+score script |
slo-aware/benchmark-results/ | our run's output: episode plots and the scored numbers |
Revert
Deleting the ScaledObject hands replica control back to you immediately:
kubectl delete -f ${SLO_DIR}/scaledobject.yaml -f ${SLO_DIR}/prometheus-rule.yaml --ignore-not-found=true
If another external-metrics adapter (e.g. prometheus-adapter) was displaced by the KEDA install, re-apply its APIService, or just remove KEDA and kube-state-metrics:
kubectl delete -f https://github.com/kedacore/keda/releases/download/v2.20.1/keda-2.20.1.yaml -f slo-aware/kube-state-metrics.yaml
Before touching a shared cluster, snapshot anything you overwrite —
kubectl get apiservice v1beta1.external.metrics.k8s.io -o yaml > /somewhere
and your Prometheus/EPP ConfigMaps — so you can restore them.