Multi-Tenant and Multi-Priority Model Serving with llm-d


You have multiple teams consuming multiple models, with use-cases of varying importance — and one pool of expensive GPU hardware to serve them all. You need to impose quotas and priorities so that no team starves another and no batch job exhausts the cluster.
In this write-up we walk through a recommended architecture for this scenario built on the llm-d open-source stack, focusing on the llm-d Async component: an asynchronous dispatch processor that provides quota management, rate limiting, and strict priority scheduling in front of your inference gateways.
The Hard Reality of Shared GPU Clusters
Large Language Model (LLM) serving on modern accelerators is a massive capital expense. Statically partitioning that hardware — dedicated node pools per team, or fixed slicing like MIG — leads to a predictable and painful result: siloed hardware with asymmetrical utilization. One team's GPUs idle at 5% over the weekend while another team's batch pipeline faces a multi-hour backlog.
To maximize ROI, hardware must be shared. However, dynamic sharing of large models introduces three critical engineering challenges:
- The Noisy Neighbor Problem: A single team launching a massive document-extraction batch (e.g., 100,000 documents) can instantly saturate the inference engine's prefill capacity, causing the interactive chat applications of other teams to experience catastrophic latency spikes or HTTP 429 timeouts.
- Priority Starvation: In a shared FIFO queue, low-priority background jobs (offline evaluations, embeddings backfills) land ahead of critical real-time requests, starving the high-priority lanes.
- Control-Plane Coupling: Synchronous HTTP gateways hold client connections open through long prefill and decode cycles. Under load, slowness cascades backward into client microservices as connection exhaustion and retry storms.
The Recommended Architecture: Decoupled & Gated Dispatch
By combining a durable queue layer with an intelligent async dispatch processor, the llm-d stack resolves these shared-pool bottlenecks by cleanly decoupling ingestion from execution:
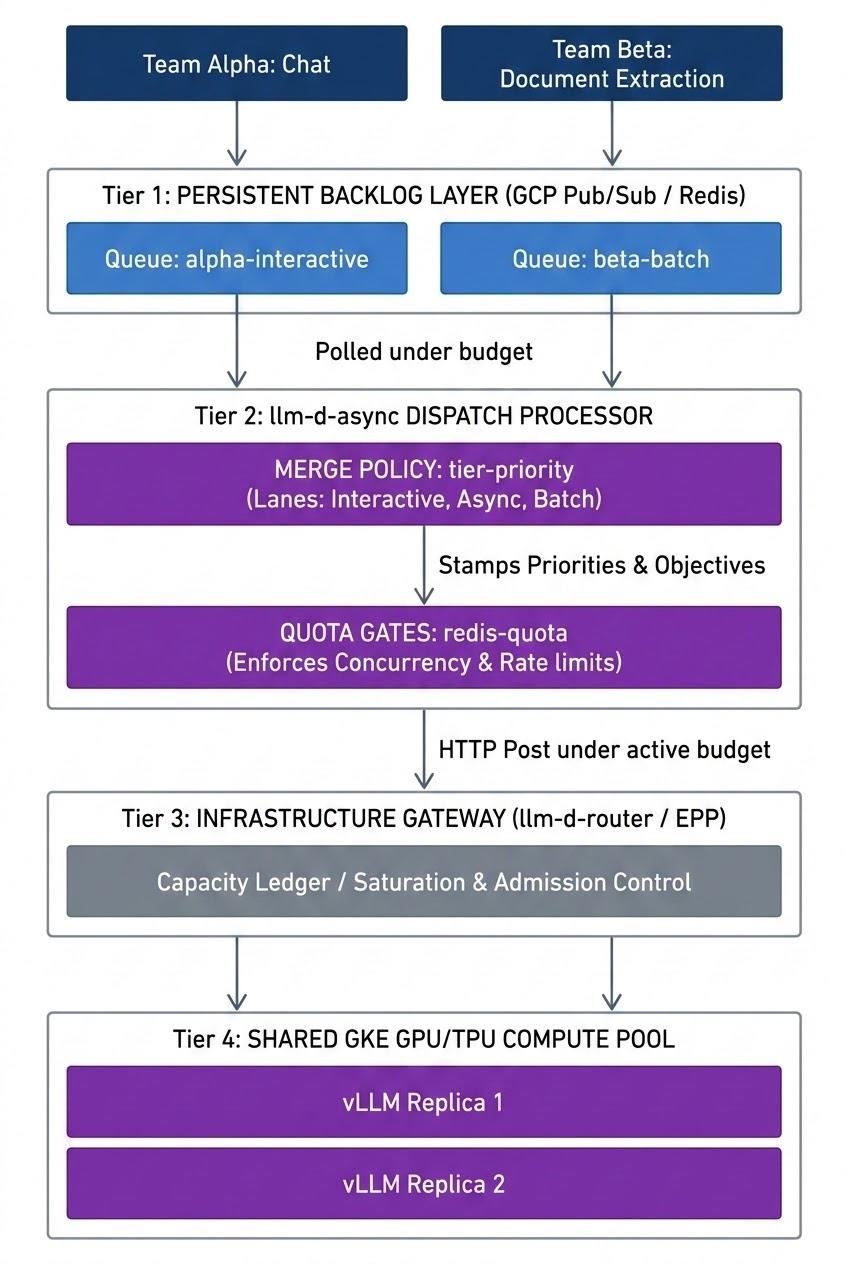
This four-tier architecture provides complete isolation, high utilization, and predictable QoS levels:
Tier 1: The Persistent Backlog Layer (Queue-per-Tenant)
Instead of teams hitting the inference gateway directly, requests are written to tenant-specific or workload-specific queues using a durable message broker (like GCP Pub/Sub or Redis). If Team Beta submits 100,000 batch requests, they accumulate safely in beta-batch with zero impact on the serving pods' memory. Producers disconnect immediately and pick up results later from a result queue.
Tier 2: llm-d Async (Gated Dispatch)
The processor consumes from all queues concurrently, but not blindly. Each queue passes through dispatch gates (quota, rate limit, capacity) and a merge policy (priority scheduling) before a worker forwards the request to the gateway. This is where isolation is enforced, and the rest of this post is mostly about this tier.
Tier 3: llm-d Router (Router-Side Admission Control)
The llm-d Router sits in front of the model servers and arbitrates in-flight traffic using flow control and saturation detection, driven by real-time engine signals such as vLLM's num_requests_waiting. Crucially, this telemetry is exported as Prometheus metrics — and llm-d Async's Prometheus-backed gates poll those same metrics to throttle dequeuing, closing an end-to-end backpressure loop: engine → router metrics → dispatch budget → queue.
Tier 4: The Shared Compute Pool
Shared model serving instances kept densely utilized across interactive and batch workloads admitted by upstream tiers.
The Isolation Pillars
To achieve true QoS isolation, your llm-d Async configuration relies on four core mechanisms:
Pillar 1: Quota and Rate-Limiting Gates
To stop noisy neighbors, llm-d Async supports a Redis-backed distributed quota gate (redis-quota) keyed on any request metadata attribute (a team ID, a user ID). Each gate runs in one of two modes: rate-limit (requests per time window) or concurrency (simultaneous in-flight requests):
{
  "gate_type": "redis-quota",
  "gate_params": {
    "address": "redis.llm-d:6379",
    "attribute": "team_id",
    "mode": "concurrency",
    "limit": "20",
    "gating_mode": "classifying"
  }
}
To enforce both axes at once, compose two quota gates with the composite gate — quota acquisition across the inner gates is all-or-nothing.
What happens when a team exceeds its quota depends on gating_mode:
blocking— over-quota messages simply stop being dequeued. They sit safely on the broker, invisible to the serving pods, until quota frees up.classifying— over-quota messages still flow, but are taggedoverflowinstead ofreserved. This tag is the input to the next pillar, and it's what turns a blunt rate limiter into a work-conserving scheduler: overflow traffic may still run when the cluster has spare capacity, but never at the expense of anyone's reserved share.
Pillar 2: Multi-Lane Priority Scheduling
Each queue declares a QoS tier via its labels (interactive, async, or batch), so a tenant's traffic is split across queues by urgency. The tier-priority merge policy combines that per-queue tier with the per-request classification from Pillar 1 into six strict priority lanes:
| Lane | Priority |
|---|---|
reserved-interactive | Highest |
reserved-async | |
reserved-batch | |
overflow-interactive | |
overflow-async | |
overflow-batch | Lowest |
When a worker frees up, lanes drain in strict order, with round-robin fairness among queues within a lane. An interactive chat request inside its quota always dispatches ahead of a document-extraction batch — and a team that has blown through its quota drops below every other team's reserved traffic, rather than being rejected outright.
Merging happens per worker pool, not globally: queues are grouped by worker_pool_id, and each pool gets its own independent merged channel. A saturated pool for one model blocks only its own channel; the pool for another model next to it keeps dispatching. That per-pool topology is the mechanism behind the isolation claims, not an aspiration.
Pillar 3: Propagating Priority to the Gateway
Scheduling doesn't stop at dispatch. The merge policy stamps two headers onto the outgoing request so the gateway's flow control continues the policy inside the serving tier:
x-llm-d-inference-objective— the lane'sInferenceObjective, mapped vialane_objectives(e.g.,reserved-interactive→premium-latency,overflow-batch→best-effort). The llm-d Router uses this to apply the matching priority and SLO treatment.x-llm-d-inference-fairness-id— the tenant identity, read from the same metadata attribute the quota gate keys on, so the identity the gateway arbitrates on is exactly the one quota was accounted against. (Prefer opaque tenant IDs over emails — this value can end up in gateway access logs.)
Pillar 4: Behavior at Saturation
The most important moments in a multi-tenant cluster are the moments there's no capacity left. The tier-priority-admission gate wraps a saturation signal (e.g., a prometheus-saturation inner gate watching the pool's saturation metric) and issues a three-way verdict when the pool is full:
- Reserved requests park: the worker waits in memory and dispatches the moment capacity frees, with no broker redelivery churn.
- Overflow interactive requests are dropped immediately with a 429 — an interactive caller gains nothing from a stale answer, so fail fast and let the client decide.
- Overflow async/batch requests are returned to the broker for redelivery with backoff — they'll run when the rush is over.
This is the difference between "we rate limit" and "we have a defined, tiered degradation policy under overload."
An Example: Two Teams, One Pool
Team Alpha runs a customer-facing chat product; team Beta runs nightly document extraction. Both share one vLLM pool.
Transport configuration (--transport redis-sortedset --transport-config-file queues.json):
{
  "url": "redis://redis.llm-d:6379/0",
  "queues": [
    {
      "queue_name": "alpha-chat",
      "igw_base_url": "http://llm-d-router.llm-d:80",
      "request_path_url": "/v1/chat/completions",
      "worker_pool_id": "shared-pool",
      "labels": { "tier": "interactive" },
      "gate_type": "redis-quota",
      "gate_params": {
        "address": "redis.llm-d:6379",
        "attribute": "team_id",
        "mode": "concurrency",
        "limit": "20",
        "gating_mode": "classifying"
      }
    },
    {
      "queue_name": "beta-batch",
      "igw_base_url": "http://llm-d-router.llm-d:80",
      "worker_pool_id": "shared-pool",
      "labels": { "tier": "batch" },
      "gate_type": "redis-quota",
      "gate_params": {
        "address": "redis.llm-d:6379",
        "attribute": "team_id",
        "mode": "rate-limit",
        "limit": "600",
        "window": "1m",
        "gating_mode": "classifying"
      }
    }
  ]
}
Worker pool with a saturation-aware admission gate (--pool-config-file):
[
  {
    "id": "shared-pool",
    "workers": 32,
    "gate_type": "tier-priority-admission",
    "gate_params": {
      "saturation_gate": "prometheus-saturation",
      "saturation_gate_params": "{\"pool\":\"shared-pool\",\"threshold\":\"0.8\"}"
    }
  }
]
Merge policy (--request-merge-policy-config-file):
{
  "type": "tier-priority",
  "parameters": {
    "fairness_attribute": "team_id",
    "lane_objectives": {
      "reserved-interactive": "premium-latency",
      "overflow-batch": "best-effort"
    }
  }
}
Now, when Beta's nightly run floods beta-batch with 100,000 requests: they queue durably, dequeue at most 600/minute, are classified reserved/overflow against that budget, always yield to Alpha's chat traffic at the merge step, and are shed back to the broker — never onto the GPUs — when the pool saturates. Alpha's users never notice the batch ran.
Benchmark: Two Teams, One Pool, Three Front Doors
We measured the two-team scenario above on a GKE cluster to see what each layer actually buys you.
Setup. Two NVIDIA A100 40GB nodes, each running one vLLM v0.25.0 replica of Qwen3-8B (--max-model-len 32768 --max-num-seqs 64), behind the llm-d Router (standalone mode, built from main in November 2026). llm-d Async v1.0.0, Redis, and kube-prometheus-stack run on CPU nodes. Prometheus scrapes the router every 10 s. The load generators run in-cluster.
Tenants.
- Alpha (interactive chat): open-loop Poisson arrivals at 4 requests/s for 11 minutes,
/v1/chat/completions, streaming, about 280 input and 128 output tokens per request. Alpha always calls the router directly withx-llm-d-inference-objective: reserved-interactiveand its fairness ID. We measure time-to-first-token (TTFT). - Beta (document extraction): a batch of 4,000
/v1/completionsrequests, about 770 input and 256 output tokens each, released 2 minutes into the run. Beta's front door is the variable.
Pool capacity. Batch-only calibration showed throughput plateauing at 128 concurrent requests across the two replicas (about 15 requests/s, 3,600 output tokens/s; 192 and 256 connections gained nothing), so we call 128 the pool's saturation concurrency. Beta's direct client opens 128, 384, or 1,280 connections ("1x", "3x", "10x" of saturation) and retries 429s with exponential backoff, the way a real batch job does. In the async configuration Beta simply publishes all 4,000 requests to its Redis queue at once.
Three front doors for Beta.
- Direct to the router, no flow control. Default scheduling plugins. This is what most people run today.
- Direct to the router with flow control. The six
InferenceObjectivepriority bands from the multi-tenant guide, Beta sendingreserved-batch, saturation detected by the guide'sconcurrency-detectorwithmaxConcurrencyset at the measured knee (64 per replica). - Queued through llm-d Async. The exact configuration from this post:
redis-quotain classifying mode, thetier-prioritymerge policy, andtier-priority-admissionoverprometheus-saturation(threshold 0.8) on a 128-worker pool, dispatching into the same flow-control router as door 2.
In every run Alpha's TTFT is the same before Beta starts (p50 44 to 47 ms, p99 about 60 ms) and returns to that level within seconds of Beta draining. The table reports the window while Beta's backlog is in flight.
| Beta's front door | Beta offered concurrency | Alpha TTFT p50 (vs idle) | Alpha TTFT p99 | Beta 429s | Beta drain time | Pool output tok/s |
|---|---|---|---|---|---|---|
| 1. Direct, no flow control | 1x (128) | 1,958 ms (41.7x) | 5,329 ms | 0 | 286 s | 3,833 |
| 1. Direct, no flow control | 3x (384) | 22,114 ms (480.7x) | 23,325 ms | 0 | 287 s | 3,994 |
| 1. Direct, no flow control | 10x (1,280) | 84,372 ms (1834.2x) | 92,704 ms | 0 | 287 s | 3,909 |
| 2. Direct + flow control | 1x (128) | 250 ms (5.7x) | 2,796 ms | 0 | 285 s | 3,984 |
| 2. Direct + flow control | 3x (384) | 226 ms (4.9x) | 3,584 ms | 0 | 284 s | 4,023 |
| 2. Direct + flow control | 10x (1,280) | 235 ms (5.0x) | 3,000 ms | 18,846 | 272 s | 3,975 |
| 3. llm-d Async, 128 workers (mean of 3 runs) | whole backlog at once | 322 ms (6.9x) | 4,303 ms | 0 | 379 s | 3,137 |
| 3. llm-d Async, 96 workers | whole backlog at once | 65 ms (1.4x) | 1,512 ms | 0 | 528 s | 2,365 |
| 3. llm-d Async, 64 workers | whole backlog at once | 69 ms (1.5x) | 298 ms | 0 | 374 s | 3,159 |
What the numbers say.
- Without admission control, the interactive tenant's latency scales with the size of the batch. At 1x, with the pool merely full, Alpha's median TTFT is already 42 times its idle value. At 3x it is 22 seconds. At 10x, vLLM holds a waiting queue of about 1,500 requests and Alpha waits a minute and a half for its first token. Beta is perfectly happy throughout: the batch drains in under 5 minutes in every baseline run. That asymmetry is the noisy neighbor problem in one row.
- Flow control bounds the damage, but it does not remove it, and it moves the pain to Beta. Alpha's TTFT is the same at 1x, 3x, and 10x, which is exactly what priority bands are for. But the bound sits at about 5x idle, because once the pool's in-flight count reaches the detector's cap, even priority-100 requests wait for a slot at the gateway (the router's own
flow_control_request_queue_duration_secondsmetric reports a mean of 160 to 200 ms for Alpha across these runs, against 1 to 17 s for Beta). And at 10x, Beta's 4,000 requests cost 22,684 attempts: 18,846 were rejected with 429 when the batch band filled, 162 never landed within the client's 25 retries, and Beta's client absorbed the retry storm. - Queuing the batch removes the rejections and the retry storm entirely. Through llm-d Async, all 4,000 requests complete with zero 429s, zero client retries, and zero failures, and Beta's producer disconnected the moment it published. With the same concurrency-detector router and the full 128 workers, Alpha sits at about 7x idle, close to door 2's floor, so the async tier at full width inherits the router's gating behavior rather than fixing it. It also drains about a third slower (379 s versus 284 s): 128 workers overshoot the router's cap before the 10 s Prometheus scrape reports it, so the saturation gate closes late and reopens all at once, and the pool oscillates instead of running flat out.
Metering the batch below saturation is the lever that isolation actually turns on. The async tier is the only place in the stack where batch admission can be shaped before it reaches the gateway. Dispatching Beta with 64 workers instead of 128 drops Alpha's median TTFT to 69 ms (1.5x idle) with a p99 of 298 ms, the best tail in the whole study. The price is drain time: the same 4,000 requests take 374 s instead of about 285 s, with the pool at roughly 80% of its peak output. That trade is explicit and tunable per pool, which is the point. Meter below the threshold, not at it: 96 workers gave Alpha a similar median (65 ms) but a 1.5 s p99 and the slowest drain in the study (528 s), because the pool brushed the saturation threshold often enough that the admission gate kept bouncing requests back to the broker, and the redelivery backoff left the pool idle for 42% of the drain.
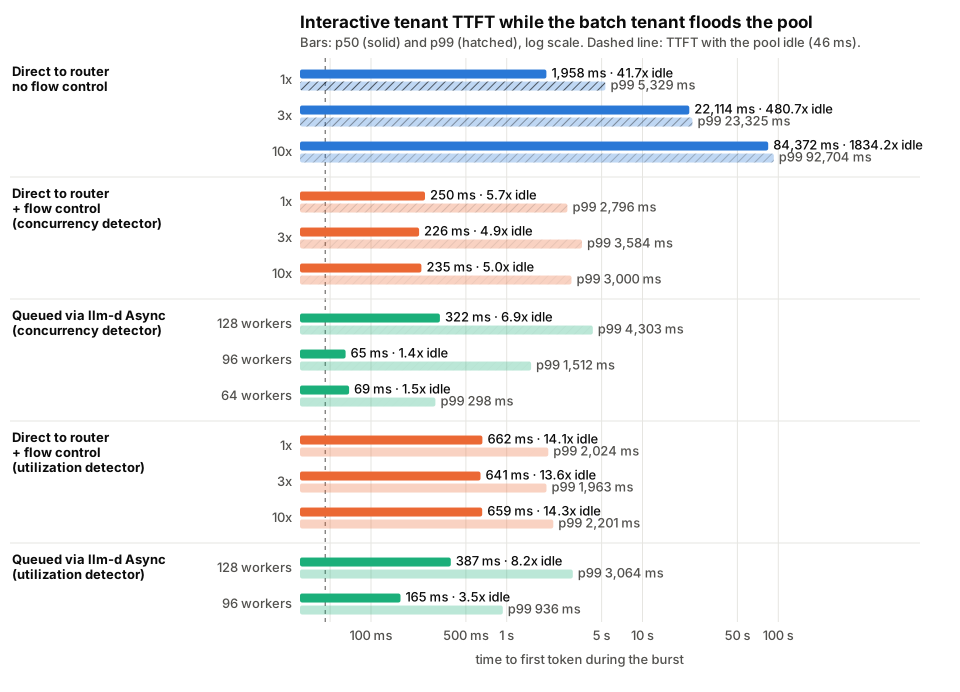
Detector choice sets the floor; the front door decides whether you reach it. We repeated doors 2 and 3 with the router's default utilization-detector (vLLM queue depth and KV-cache pressure) instead of the concurrency detector.
| Beta's front door | Beta offered concurrency | Alpha TTFT p50 (vs idle) | Alpha TTFT p99 | Beta 429s | Beta drain time | Pool output tok/s |
|---|---|---|---|---|---|---|
| 2. Direct + flow control | 1x (128) | 662 ms (14.1x) | 2,024 ms | 0 | 288 s | 3,828 |
| 2. Direct + flow control | 3x (384) | 641 ms (13.6x) | 1,963 ms | 0 | 287 s | 3,895 |
| 2. Direct + flow control | 10x (1,280) | 659 ms (14.3x) | 2,201 ms | 21,604 | 281 s | 3,906 |
| 3. llm-d Async, 128 workers | whole backlog at once | 387 ms (8.2x) | 3,064 ms | 0 | 368 s | 3,197 |
| 3. llm-d Async, 96 workers | whole backlog at once | 165 ms (3.5x) | 936 ms | 0 | 322 s | 3,529 |
The utilization detector holds at every burst size, but it holds Alpha at about 14x idle where the calibrated concurrency detector holds it at 5x: it reacts to the engine's waiting queue and KV-cache pressure rather than to the in-flight count, so by the time it trips, Alpha's requests are already behind a queue. It also rejects more at 10x (21,604 429s, 25,519 attempts for 4,000 requests). On the same router, the queued path moves the floor: 128 workers lands Alpha at 8x, and 96 workers at 3.5x with a p99 under a second, because the dispatcher never presents the router with a burst in the first place. Under either detector, the lever that brings the interactive tenant close to idle sits upstream of the router. (An earlier run of this benchmark on llm-d Async v0.10.0 and vLLM v0.19.1 saw this detector fail outright at 3x and 10x, with Alpha's median at 11 to 16 s; on current versions it does not.)
We also pushed the utilization detector harder to find where it breaks: 10x bursts against 2,000-deep priority bands, so the router queues the backlog instead of rejecting it, with Alpha at 4 and 12 requests/s and Beta prompts of 770 and 1,800 tokens. In all four cells Alpha stayed between 10x and 21x idle at the median and under 2.3 s at p99, and the deep band removed the retry storm entirely: every Beta request landed on its first attempt. The sizing lesson is the band depth. A 500-deep band turns a 10x burst into tens of thousands of 429s; a 2,000-deep band turns it into queueing time that a batch tenant does not mind.
Caveats. One model, one pool, one hardware configuration, one prompt mix. Alpha calls the router directly in all setups, so its TTFT reflects the gateway and the engine rather than the queue; an interactive tenant that also went through alpha-chat would see completion latency instead of streaming TTFT. The absolute floor for Alpha is set by vLLM itself: with the pool at its 128-sequence knee, the engine's own scheduling adds roughly 1.5x to first-token latency on this hardware, so "within a few percent of idle" is not reachable while the pool is fully utilized. The router image tracks main and was restarted between the two tables, so they may not be the identical build.
Reliability Is Part of Isolation
Multi-tenancy isn't only about scheduling; it's about what happens when things fail:
- Deadlines. Every request carries a mandatory deadline. Failed or shed messages retry with exponential backoff until the deadline, after which the producer gets an explicit
DEADLINE_EXCEEDEDresult. A stuck tenant's backlog expires; it doesn't rot on the broker forever. - At-least-once processing. On Pub/Sub, requests ride exactly-once subscriptions with a dead-letter queue; on Redis, the sorted-set transport uses claim-based durable dequeue, so a processor crash mid-flight means redelivery, not loss.
- Durable result delivery. Producers can consume results with a lease/acknowledge protocol (receive → checkpoint → ack), so a crashing consumer never drops a result it hadn't durably recorded.
- Failure decoupling. A slowdown or outage in the serving tier never propagates to client microservices — producers only ever talk to the broker.
Observability
Every gate decision and queue is measurable, which is what makes tenant disputes tractable. The processor exports Prometheus metrics under the llm_d_async_async_ prefix, including gate_decisions_total (why requests were refused, per queue), dispatch_budget (how open each gate currently is), broker_backlog and queue_depth, deadline_proximity_millis (backlog at risk of expiring), inflight_requests, tokens_total, and end-to-end latency histograms — with Grafana dashboards for backlog, in-process load, token usage, and deadline proximity available out of the box. "Show me the gate refusing Team Beta at 02:00" is a query, not an investigation.
Business and Operational Outcomes
By deploying this gated-dispatch architecture, platform engineering teams can expect the following results:
- Higher GPU utilization from a single shared pool: Running one dense, shared GPU/TPU pool rather than dedicated clusters per team removes the idle capacity that static partitioning locks up. How much you save scales with how asymmetric your teams' utilization is; in the benchmark above, a batch tenant filled the capacity an interactive tenant left unused without the interactive tenant paying for it.
- Bounded interactive latency under any size of backlog: In our measurements, a batch backlog offered at 10x the pool's saturation concurrency pushed the interactive tenant's median time-to-first-token (TTFT) to a minute and a half on a plain router. Queued through llm-d Async with the batch metered at half of saturation, the same backlog completed with zero rejections while interactive TTFT stayed within 1.5x of idle at the median and under 300 ms at p99, and the bound did not depend on how large the backlog was.
- Decoupled System Reliability: Slowdowns or outages on the model servers do not cascade to client microservices. Client applications simply write requests directly to their respective backlog queues and decouple immediately, remaining completely insulated from downstream inference pressure. In the benchmark, the direct batch client needed 22,684 attempts to land 3,838 of its 4,000 requests through a saturated gateway; the queued client published once, disconnected, and got all 4,000 results.
Getting Started
To begin building your own multi-tenant, multi-priority model serving stack, check out our complete, step-by-step Multi-Tenant Deployment Guide, which contains full Helm values, Prometheus scrape configurations, and load-test scripts to validate isolation under high batch loads.